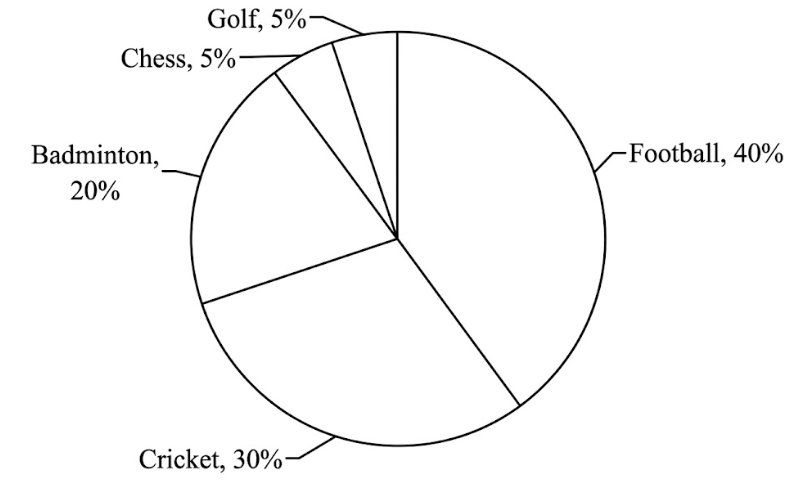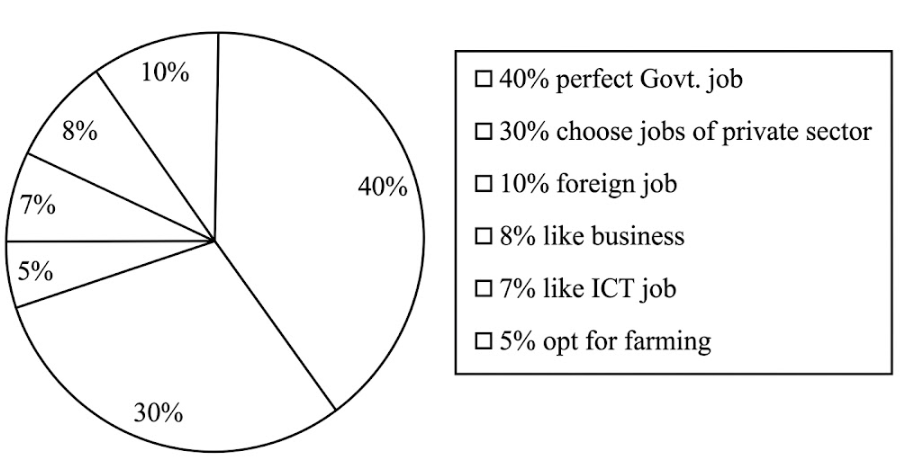
The pie chart below shows the percentage of supporters of different games and sports of our country. Now describe the chart in about 150 words. You should highlight and summarize the information given in the chart. [চিত্র]
উত্তর: The chart shows the percentage of supporters of different games of a country. Six different categories have been shown here. These are Football, Cricket, Badminton, Chess and Golf. In the chart, the highest segment is Football and the smallest segment is Chess or Golf. From the chart, it is obvious that there is significant difference between the highest and the smallest percentage and it is 35 % ( 40 % -5 % ). There is also significant difference between the parts like Badminton and Chess and it is 15 % ( 20 % -5 % ). In contrast, there is no significant difference between the highest and the second highest parts and it is 10 % ( 40 % -30 % ). There is no difference between the two parts like Chess and Golf. An important observation is that only the highest and the second highest part occupy the lion's share of the chart and it is 70 %. In contrast, the other parts occupy only the rest 30 % segment of the chart.
SSC English 1st Paper Interpreting graph/chart (Old Syllabus) CQ — Prosthuti প্রশ্নব্যাংক
SSC · English 1st Paper · Interpreting graph/chart (Old Syllabus) · সৃজনশীল
The pie chart below shows the percentage of supporters of different games and sports of our country. Now describe the chart in about 150 words. You should highlight and summarize the information given in the chart.

উত্তর