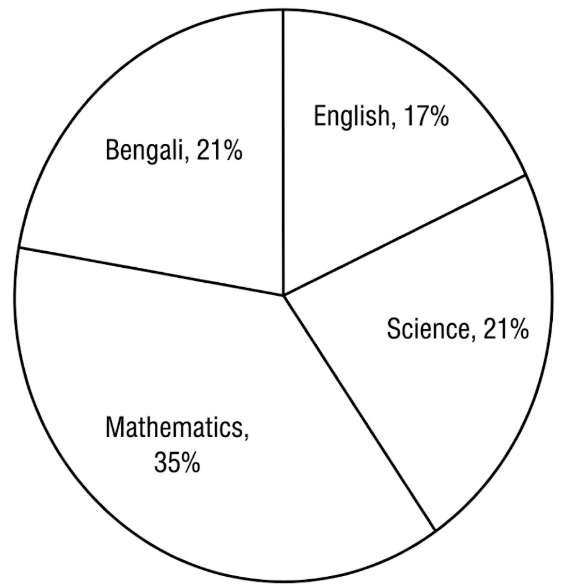
The pie-chart below shows the interest of a secondary school in different subjects. Describe the chart in about 150 words. You should highlight and summarise the information given in the chart. [চিত্র]
উত্তর: The pie chart shows the percentage of students of a secondary school who are interested in different subjects like Bengali, English, Science and Mathematics. According to the chart, [গণিত] students are interested in Bengali. English shows only [গণিত] and it is the lowest percentage among the mentioned four subjects. However, Mathematics is preferred by the highest number of students. 35 % students show interest in Mathematics. Then, Science has got the second position and [গণিত] students are interested in this subject. So, from the overall picture of the chart, it can be said that most of the students of the school are interested in Mathematics. A majority of them has some aversion to English and Bengali.
SSC English 1st Paper Interpreting graph/chart (Old Syllabus) CQ — Prosthuti প্রশ্নব্যাংক
SSC · English 1st Paper · Interpreting graph/chart (Old Syllabus) · সৃজনশীল
The pie-chart below shows the interest of a secondary school in different subjects. Describe the chart in about 150 words. You should highlight and summarise the information given in the chart.
উত্তর