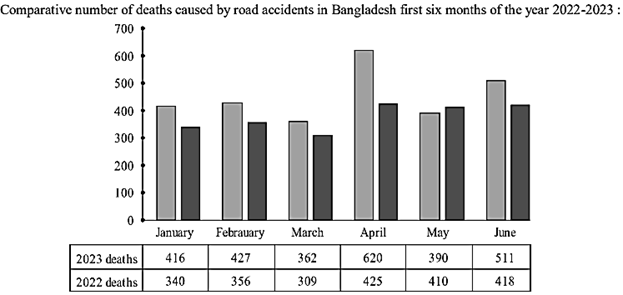
Look at the following graph. It shows the comparative number of deaths caused by road accidents in the first six month of the year 2022 and 2023. Now describe the graph in your own words in 150 words. You are advised [গণিত] highlight and summarize the information given in the graph. [চিত্র]
উত্তর: The bar graph provides a comparative analysis of road accident fatalities in Bangladesh for the initial six months of 2022 and 2023. Overall, the data indicates a concerning rise in the number of deaths in 2023 across all months. 416 people died by road accidents in January, 2023 and 340 people died in January, 2022. There were 427 deaths in February, 2023 and 356 deaths in February, 2022. The lowest number of deaths can be noticed in March of 2023 and 2022, which are 362 and 309 respectively. On the contrary, the highest numbers of deaths in the graph are shown to have occurred in April of 2023 and 2022 when 620 and 425 people died respectively. Then in May of 2023 and 2022 there were 390 and 410 deaths respectively. Lastly, June, with a number of deaths higher than May, recorded 511 people dead in 2023 and 418 people in 2022. In conclusion, the number of deaths in 2023 was higher.
SSC English 1st Paper Interpreting graph/chart (Old Syllabus) CQ — Prosthuti প্রশ্নব্যাংক
SSC · English 1st Paper · Interpreting graph/chart (Old Syllabus) · সৃজনশীল
Look at the following graph. It shows the comparative number of deaths caused by road accidents in the first six month of the year 2022 and 2023. Now describe the graph in your own words in 150 words. You are advised graph.
উত্তর