শেয়ারFacebookWhatsApp

Look at the following graph chart. It shows obtained marks of Tapan, a student of class ten in different subjects. Describe the graph in about 150 words. You should highlight and summarize the information given below. [চিত্র]
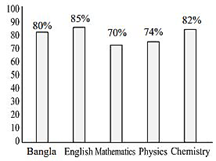
উত্তর: The bar chart illustrates the percentage marks obtained by a student named Tapan in five different academic subjects: English, Chemistry, Bangla, Physics, and Mathematics. Overall, Tapan performed well across all subjects, with every score being 70% or higher. There is a clear hierarchy in his results, with his highest score being in English and his lowest in Mathematics. The difference between his best and worst subject was 15 percentage points. Delving into the specifics, Tapan's top score was 85% in English. This was followed closely by two other strong performances in Chemistry and Bangla, where he secured 82% and 80% respectively. In contrast, his marks were comparatively lower in the other two subjects. He obtained 74% in Physics, while his weakest performance was in Mathematics, where he received a mark of exactly 70%. The chart clearly arranges the subjects from his highest-scoring to his lowest-scoring discipline.

SSC English 1st Paper Interpreting graph/chart (Old Syllabus) CQ — Prosthuti প্রশ্নব্যাংক

SSC · English 1st Paper · Interpreting graph/chart (Old Syllabus) · সৃজনশীল

Look at the following graph chart. It shows obtained marks of Tapan, a student of class ten in different subjects. Describe the graph in about 150 words. You should highlight and summarize the information given below. question image

উত্তর

The bar chart illustrates the percentage marks obtained by a student named Tapan in five different academic subjects: English, Chemistry, Bangla, Physics, and Mathematics. Overall, Tapan performed well across all subjects, with every score being 70% or higher. There is a clear hierarchy in his results, with his highest score being in English and his lowest in Mathematics. The difference between his best and worst subject was 15 percentage points. Delving into the specifics, Tapan's top score was 85% in English. This was followed closely by two other strong performances in Chemistry and Bangla, where he secured 82% and 80% respectively. In contrast, his marks were comparatively lower in the other two subjects. He obtained 74% in Physics, while his weakest performance was in Mathematics, where he received a mark of exactly 70%. The chart clearly arranges the subjects from his highest-scoring to his lowest-scoring discipline.
SSCEnglish 1st PaperInterpreting graph/chart (Old Syllabus)
12টি সম্পর্কিত প্রশ্ন — ব্যাখ্যা লকড

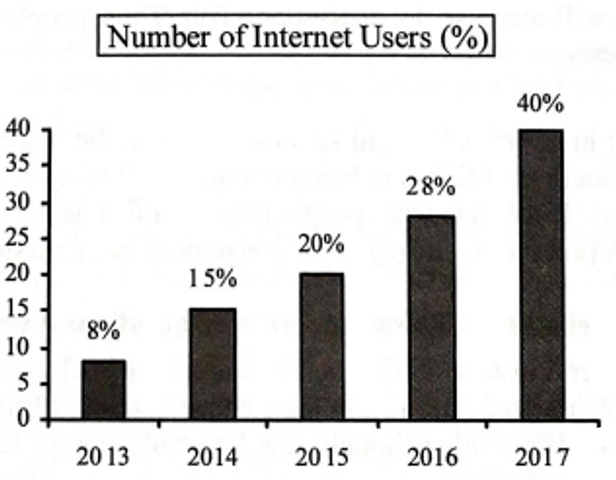
1.The graph below shows the number of people using the internet from the year 2013 →2017in\to 2017 in Bangladesh. Now, describe the graph in 150 words. You should highlight and summarize the information given in the graph: question image

The graph below shows the number of people using the internet from the year 2013 →2017in\to 2017 in Bangladesh. Now, describe the graph in 150 words. You should highlight and summarize the information given in the graph: question image

উত্তর ও ব্যাখ্যা দেখতে ফ্রি রেজিস্ট্রেশন করো

ফ্রি শুরু করো

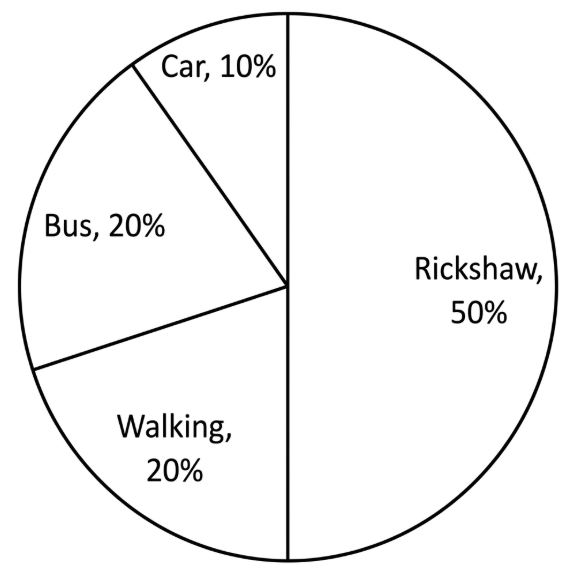
2.The pie chart below shows the percentage of transportation used by the students →come→their\to come \to their school. Describe the chart in 150 words. You should highlight and summarize the information given in the chart. question image

The pie chart below shows the percentage of transportation used by the students →come→their\to come \to their school. Describe the chart in 150 words. You should highlight and summarize the information given in the chart. question image

উত্তর ও ব্যাখ্যা দেখতে ফ্রি রেজিস্ট্রেশন করো

ফ্রি শুরু করো

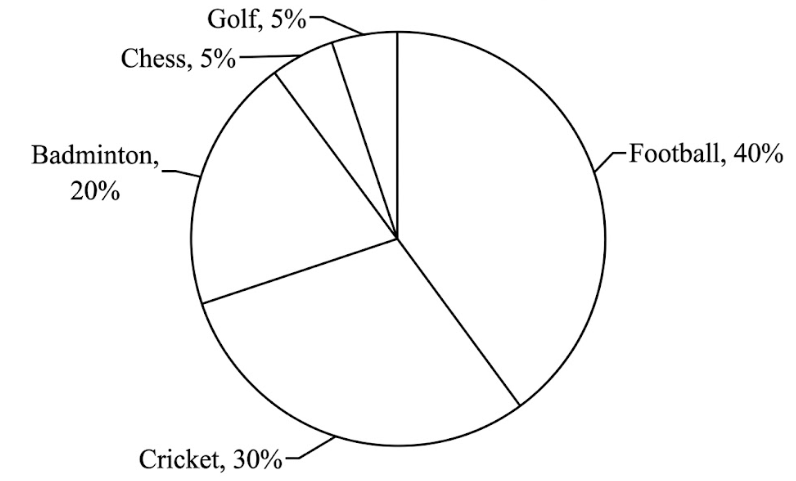
3.The pie chart below shows the percentage of supporters of different games of a country. Now, describe the chart in about 150 words. You should highlight and summarize the information given in the chart. question image

The pie chart below shows the percentage of supporters of different games of a country. Now, describe the chart in about 150 words. You should highlight and summarize the information given in the chart. question image

উত্তর ও ব্যাখ্যা দেখতে ফ্রি রেজিস্ট্রেশন করো

ফ্রি শুরু করো

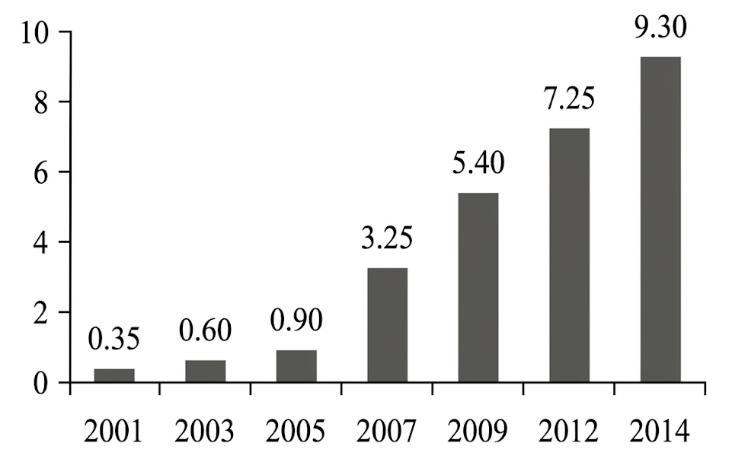
4.The graph below shows "The Number of Telephone and Mobile Users" from 2001 →2014.Describethegraphin150\to 2014. Describe the graph in 150 words. You should highlight and summarize the information given in the graph . question image

The graph below shows "The Number of Telephone and Mobile Users" from 2001 →2014.Describethegraphin150\to 2014. Describe the graph in 150 words. You should highlight and summarize the information given in the graph . question image

উত্তর ও ব্যাখ্যা দেখতে ফ্রি রেজিস্ট্রেশন করো

ফ্রি শুরু করো

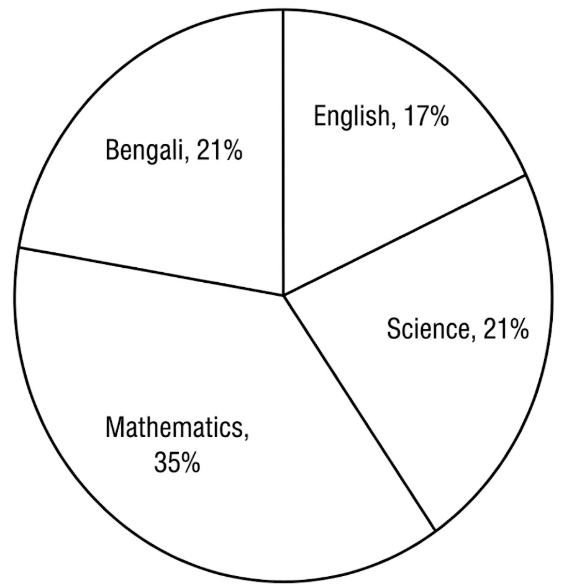
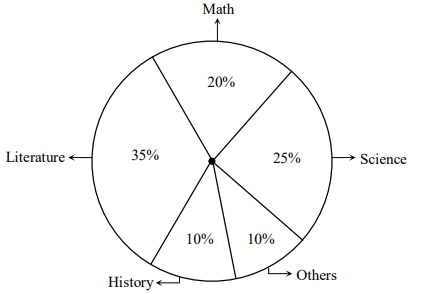
5.The pie-chart below shows the interest of a secondary school in different subjects. Describe the chart in about 150 words. You should highlight and summarise the information given in the chart. question image

The pie-chart below shows the interest of a secondary school in different subjects. Describe the chart in about 150 words. You should highlight and summarise the information given in the chart. question image

উত্তর ও ব্যাখ্যা দেখতে ফ্রি রেজিস্ট্রেশন করো

ফ্রি শুরু করো

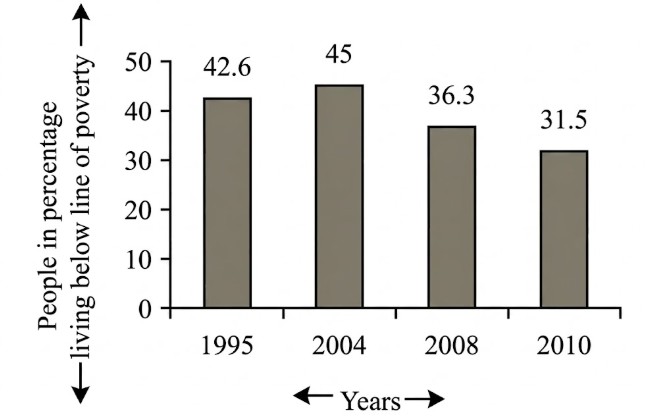
6.The graph below shows "The number of people in percentage, living below the poverty line" from 1995 →2010.Describethegraphsin150\to 2010. Describe the graphs in 150 words. You should highlight and summarize the information given in the graph. question image

The graph below shows "The number of people in percentage, living below the poverty line" from 1995 →2010.Describethegraphsin150\to 2010. Describe the graphs in 150 words. You should highlight and summarize the information given in the graph. question image

উত্তর ও ব্যাখ্যা দেখতে ফ্রি রেজিস্ট্রেশন করো

ফ্রি শুরু করো

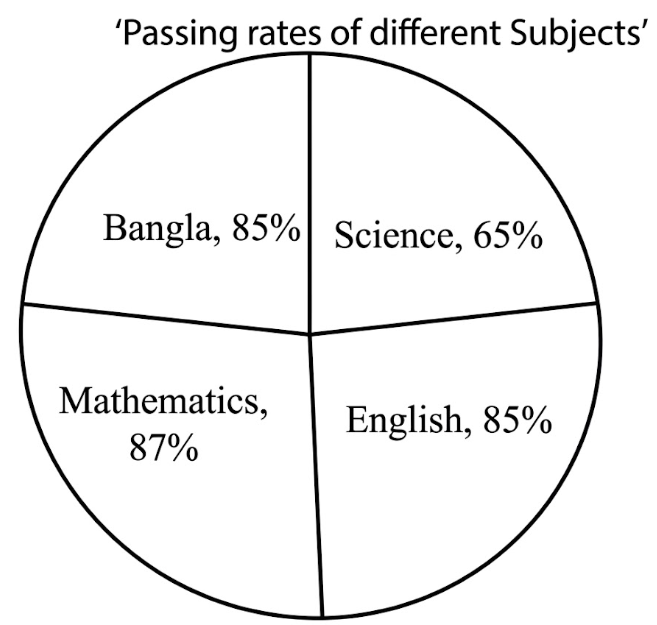
7.Look at the following pie-chart. It represents the passing rates of the students in different subjects of a school. Now, describe the chart in your own words. question image

Look at the following pie-chart. It represents the passing rates of the students in different subjects of a school. Now, describe the chart in your own words. question image

উত্তর ও ব্যাখ্যা দেখতে ফ্রি রেজিস্ট্রেশন করো

ফ্রি শুরু করো

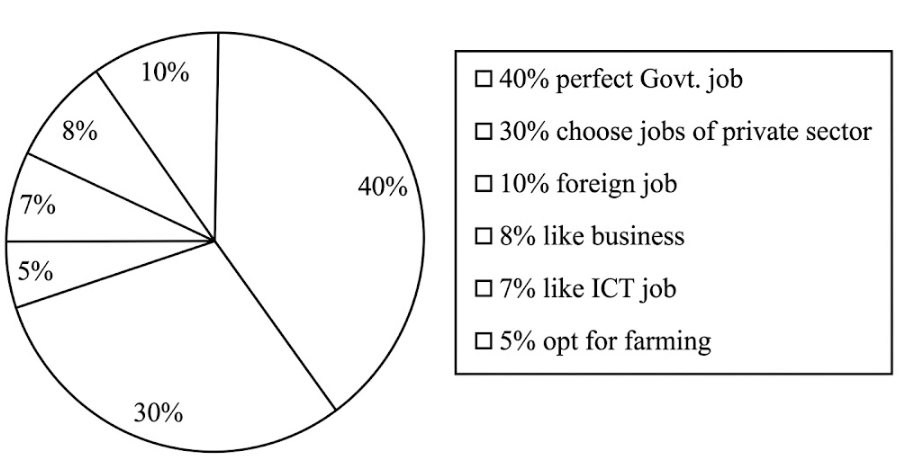
8.Look at the following pie-chart. It shows the choice of professions by different educated youths in Bangladesh. Now, describe the pie-chart in your own words in 150 words. You are advised →highlightandsummarizetheinformationgiveninthe\to highlight and summarize the information given in the pie-chart. question image

Look at the following pie-chart. It shows the choice of professions by different educated youths in Bangladesh. Now, describe the pie-chart in your own words in 150 words. You are advised →highlightandsummarizetheinformationgiveninthe\to highlight and summarize the information given in the pie-chart. question image

উত্তর ও ব্যাখ্যা দেখতে ফ্রি রেজিস্ট্রেশন করো

ফ্রি শুরু করো

9.Look at the chart below. It is about the importance and uses of English. Now, describe the chart in 150 words. You should highlight and summarize the information given in the chart: question image

Look at the chart below. It is about the importance and uses of English. Now, describe the chart in 150 words. You should highlight and summarize the information given in the chart: question image

উত্তর ও ব্যাখ্যা দেখতে ফ্রি রেজিস্ট্রেশন করো

ফ্রি শুরু করো

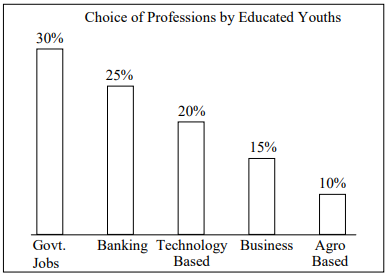
10.Look at the graph below. It shows the choice of professions by educated youths in Bangladesh. Now, describe the graph in about 150 words. You should highlight and summarize the information given in the graph: question image

Look at the graph below. It shows the choice of professions by educated youths in Bangladesh. Now, describe the graph in about 150 words. You should highlight and summarize the information given in the graph: question image

উত্তর ও ব্যাখ্যা দেখতে ফ্রি রেজিস্ট্রেশন করো

ফ্রি শুরু করো

11.The pie chart below shows the percentage of books in a school library. Describe the chart in your own words. You should highlight and summarize the information given in the chart. question image

The pie chart below shows the percentage of books in a school library. Describe the chart in your own words. You should highlight and summarize the information given in the chart. question image

উত্তর ও ব্যাখ্যা দেখতে ফ্রি রেজিস্ট্রেশন করো

ফ্রি শুরু করো

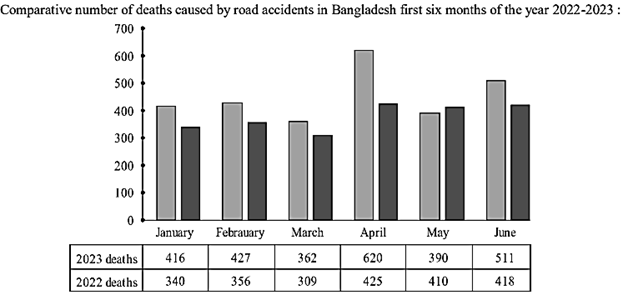
12.Look at the following graph. It shows the comparative number of deaths caused by road accidents in the first six month of the year 2022 and 2023. Now describe the graph in your own words in 150 words. You are advised →highlightandsummarizetheinformationgiveninthe\to highlight and summarize the information given in the graph. question image

Look at the following graph. It shows the comparative number of deaths caused by road accidents in the first six month of the year 2022 and 2023. Now describe the graph in your own words in 150 words. You are advised →highlightandsummarizetheinformationgiveninthe\to highlight and summarize the information given in the graph. question image

উত্তর ও ব্যাখ্যা দেখতে ফ্রি রেজিস্ট্রেশন করো

ফ্রি শুরু করো

আরো প্রশ্ন দেখো

আরো হাজারো প্রশ্ন + মডেল টেস্ট

ফ্রি রেজিস্ট্রেশন করো — ফেভারিট, AI টিউটর, লিডারবোর্ড ও অ্যানালিটিক্স আনলক করো।