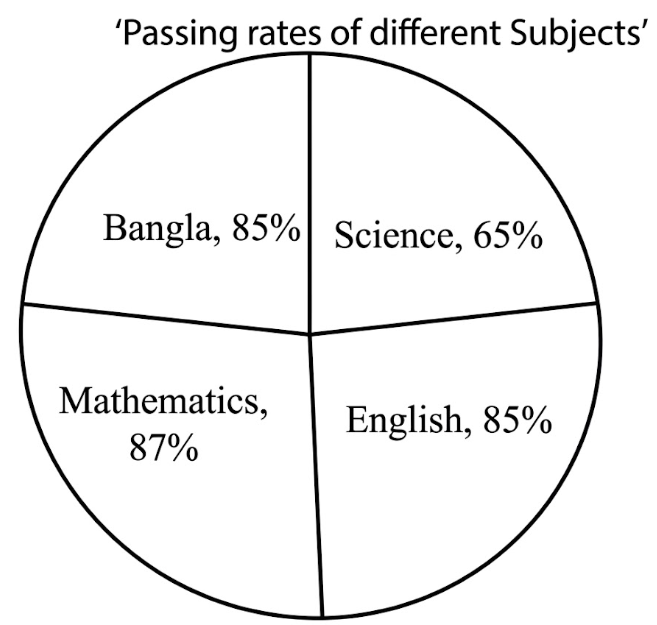
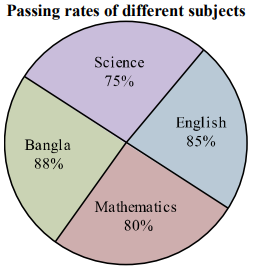
Look at the following pie-chart. It represents the passing rates of different subjects of the students of a school. Now describe the chart in your own language. You should highlight and summarise the information given in the chart. [চিত্র]
উত্তর: The Passing Rates of Different Subjects of a School The pie-chart shows the passing rate of different subjects of a school in the SSC examination There are four subjects showing the chart. These subjects are; Bangla, English, Mathematics, and Science. The graph shows that the highest number of students pass in Bangla and it is 88%. The second highest is in English and this is 85%. Again, 80% of students pass in Mathematics and 75% of students pass in Science. From this chart, it is clear that the highest number of students pass in. Bangla and the lowest number of students pass in Science. From the graph, we can also calculate the rate of failure in these subjects. It is found that 12% of students fail in Bangla, 15% fail in English, 20% fail in Mathematics and 25% fail in Science. If we make a list considering the highest passing rate to the lowest, the serial goes like this: Bangla, English, Mathematics, and Science. Thus, the pie chart very clearly shows the percentage of students passing in these four subjects.
SSC English 1st Paper Interpreting graph/chart (Old Syllabus) CQ — Prosthuti প্রশ্নব্যাংক
SSC · English 1st Paper · Interpreting graph/chart (Old Syllabus) · সৃজনশীল
Look at the following pie-chart. It represents the passing rates of different subjects of the students of a school. Now describe the chart in your own language. You should highlight and summarise the information given in the chart.
উত্তর