শেয়ারFacebookWhatsApp

The following graph shows the GDP growth rate of Bangladesh in percentage from the fiscal year 2007 [গণিত] 2016. Describe the chart in at least 150-180 words. You should highlight and summarize the information given in the graph. [চিত্র]

উত্তর: The GDP growth rate of Bangladesh in percentage from the fiscal year 2007 to 2016 The graph shows the GDP growth rate of Bangladesh in percentage from the fiscal year 2007 to 2016. At the first glance, the chart shows a heavy fluctuation in GDP growth during the given period. According to the graph, the years 2007 and 2008 show GDP to be 6.43% and 6.19% respectively, Indicating a gradual decrease. Sadly, the decreasing tendency (প্রবণতা) assumed a serious turn in 2009 when GDP came down to 5.05%. But, the next year that is in 2010, GDP slightly rose up to 5.57%. Then in 2011, we notice a great rise and GDP in this year shows itself to be 6.46%. In the following year (2012), we see GDP to be 6.52%, indicating a little increase. A fall in GDP is again noticed in 2013 when it came down to 6.01%. In the next year 2014, GDP grew slightly and rose up to 6.06%. However, in the following two consecutive (ধারাবাহিক) years, that is in 2015 and 2016 the last two years of the survey period, GDP growth was a little bit on rise going up to 6.55% and 7.11% respectively. Thus, the graph clarifies the point that annual GDP in Bangladesh went on in the process of great rise and fall, showing an uncertain state. বাংলা অনুবাদ: ২০০৭ থেকে ২০১৬ অর্থবছরের মধ্যে বাংলাদেশের জিডিপির বার্ষিক বৃদ্ধির হার (শতকরা)গ্রাফটি ২০০৭ থেকে ২০১৬ অর্থবছরের মধ্যে বাংলাদেশের জিডিপির বৃদ্ধির হার শতকরা হিসেবে প্রদর্শন করেছে। প্রথম নজরে, এই চার্টে দেওয়া সময়কালে জিডিপিতে ব্যাপক ওঠানামা দেখা যায়।গ্রাফ অনুযায়ী, ২০০৭ ও ২০০৮ সালে জিডিপি যথাক্রমে ৬.৪৩% এবং ৬.১৯% ছিল, যা ধীরে ধীরে হ্রাসের ইঙ্গিত দেয়। দুঃখজনকভাবে, ২০০৯ সালে হ্রাসের প্রবণতা আরও তীব্র হয় এবং জিডিপি নামিয়ে আসে ৫.০৫% এ। কিন্তু পরের বছর অর্থাৎ ২০১০ সালে জিডিপি সামান্য বৃদ্ধি পেয়ে ৫.৫৭% হয়। এরপর ২০১১ সালে জিডিপিতে বড় ধরনের বৃদ্ধি লক্ষ্য করা যায়, যা হয় ৬.৪৬%। পরবর্তী বছর ২০১২-এ সামান্য বাড়তি নিয়ে জিডিপি দাঁড়ায় ৬.৫২%। আবার ২০১৩ সালে জিডিপি কিছুটা কমে ৬.০১% এ নেমে আসে। ২০১৪ সালে জিডিপি সামান্য বৃদ্ধি পেয়ে ৬.০৬% এ ওঠে। তবে পরবর্তী দুই বছর ২০১৫ ও ২০১৬-এ ধারাবাহিকভাবে জিডিপির বৃদ্ধি লক্ষ্য করা যায়, যথাক্রমে ৬.৫৫% ও ৭.১১%।অতএব, এই গ্রাফ থেকে স্পষ্ট হয় যে বাংলাদেশের বার্ষিক জিডিপি অনেক ওঠানামার মধ্যে দিয়ে গেছে, যা একটি অনিশ্চিত অবস্থা নির্দেশ করে।

HSC English 1st Paper Writing : Interpreting graph/chart CQ — Prosthuti প্রশ্নব্যাংক

HSC · English 1st Paper · Writing : Interpreting graph/chart · সৃজনশীল

The following graph shows the GDP growth rate of Bangladesh in percentage from the fiscal year 2007 →2016.Describethechartinatleast150−180\to 2016. Describe the chart in at least 150-180 words. You should highlight and summarize the information given in the graph. question image

উত্তর

The GDP growth rate of Bangladesh in percentage from the fiscal year 2007 to 2016 The graph shows the GDP growth rate of Bangladesh in percentage from the fiscal year 2007 to 2016. At the first glance, the chart shows a heavy fluctuation in GDP growth during the given period. According to the graph, the years 2007 and 2008 show GDP to be 6.43% and 6.19% respectively, Indicating a gradual decrease. Sadly, the decreasing tendency (প্রবণতা) assumed a serious turn in 2009 when GDP came down to 5.05%. But, the next year that is in 2010, GDP slightly rose up to 5.57%. Then in 2011, we notice a great rise and GDP in this year shows itself to be 6.46%. In the following year (2012), we see GDP to be 6.52%, indicating a little increase. A fall in GDP is again noticed in 2013 when it came down to 6.01%. In the next year 2014, GDP grew slightly and rose up to 6.06%. However, in the following two consecutive (ধারাবাহিক) years, that is in 2015 and 2016 the last two years of the survey period, GDP growth was a little bit on rise going up to 6.55% and 7.11% respectively. Thus, the graph clarifies the point that annual GDP in Bangladesh went on in the process of great rise and fall, showing an uncertain state. বাংলা অনুবাদ: ২০০৭ থেকে ২০১৬ অর্থবছরের মধ্যে বাংলাদেশের জিডিপির বার্ষিক বৃদ্ধির হার (শতকরা)গ্রাফটি ২০০৭ থেকে ২০১৬ অর্থবছরের মধ্যে বাংলাদেশের জিডিপির বৃদ্ধির হার শতকরা হিসেবে প্রদর্শন করেছে। প্রথম নজরে, এই চার্টে দেওয়া সময়কালে জিডিপিতে ব্যাপক ওঠানামা দেখা যায়।গ্রাফ অনুযায়ী, ২০০৭ ও ২০০৮ সালে জিডিপি যথাক্রমে ৬.৪৩% এবং ৬.১৯% ছিল, যা ধীরে ধীরে হ্রাসের ইঙ্গিত দেয়। দুঃখজনকভাবে, ২০০৯ সালে হ্রাসের প্রবণতা আরও তীব্র হয় এবং জিডিপি নামিয়ে আসে ৫.০৫% এ। কিন্তু পরের বছর অর্থাৎ ২০১০ সালে জিডিপি সামান্য বৃদ্ধি পেয়ে ৫.৫৭% হয়। এরপর ২০১১ সালে জিডিপিতে বড় ধরনের বৃদ্ধি লক্ষ্য করা যায়, যা হয় ৬.৪৬%। পরবর্তী বছর ২০১২-এ সামান্য বাড়তি নিয়ে জিডিপি দাঁড়ায় ৬.৫২%। আবার ২০১৩ সালে জিডিপি কিছুটা কমে ৬.০১% এ নেমে আসে। ২০১৪ সালে জিডিপি সামান্য বৃদ্ধি পেয়ে ৬.০৬% এ ওঠে। তবে পরবর্তী দুই বছর ২০১৫ ও ২০১৬-এ ধারাবাহিকভাবে জিডিপির বৃদ্ধি লক্ষ্য করা যায়, যথাক্রমে ৬.৫৫% ও ৭.১১%।অতএব, এই গ্রাফ থেকে স্পষ্ট হয় যে বাংলাদেশের বার্ষিক জিডিপি অনেক ওঠানামার মধ্যে দিয়ে গেছে, যা একটি অনিশ্চিত অবস্থা নির্দেশ করে।
HSCEnglish 1st PaperWriting : Interpreting graph/chart
12টি সম্পর্কিত প্রশ্ন — ব্যাখ্যা লকড

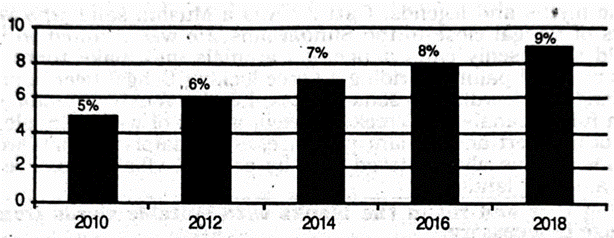
1.The graph shows "The economic growth rate of Bangladesh from 2010 →2018\to 2018 ". Describe in 150 words. question image

The graph shows "The economic growth rate of Bangladesh from 2010 →2018\to 2018 ". Describe in 150 words. question image

উত্তর ও ব্যাখ্যা দেখতে ফ্রি রেজিস্ট্রেশন করো

ফ্রি শুরু করো

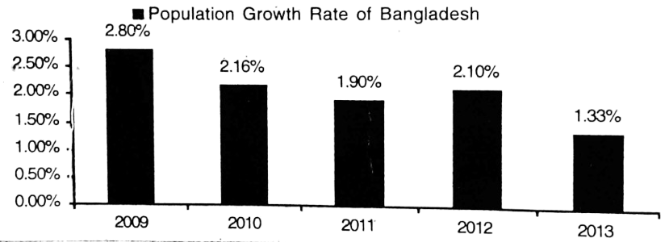
2.The graph below shows "Population Growth Rate" from 2009 →2013.Describethegraphinafleast80wordshighlightingtheinformationgiveninthe\to 2013. Describe the graph in af least 80 words highlighting the information given in the graph. question image

The graph below shows "Population Growth Rate" from 2009 →2013.Describethegraphinafleast80wordshighlightingtheinformationgiveninthe\to 2013. Describe the graph in af least 80 words highlighting the information given in the graph. question image

উত্তর ও ব্যাখ্যা দেখতে ফ্রি রেজিস্ট্রেশন করো

ফ্রি শুরু করো

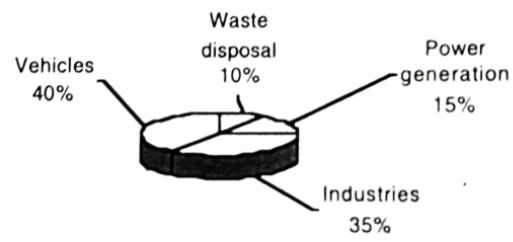
3.Look at the chart below. It shows the sources of air pollution in Dhaka. Now, analyze the chart in at least 80 words focusing the main aspects. question image

Look at the chart below. It shows the sources of air pollution in Dhaka. Now, analyze the chart in at least 80 words focusing the main aspects. question image

উত্তর ও ব্যাখ্যা দেখতে ফ্রি রেজিস্ট্রেশন করো

ফ্রি শুরু করো

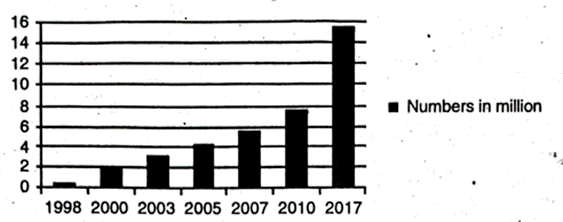
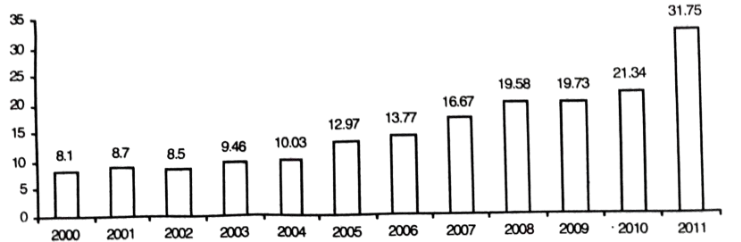
4.Look at the following graph. It shows the number of mobile phone users in Bangladesh. The point is shows in mllion. Now, describe the graph. question image

Look at the following graph. It shows the number of mobile phone users in Bangladesh. The point is shows in mllion. Now, describe the graph. question image

উত্তর ও ব্যাখ্যা দেখতে ফ্রি রেজিস্ট্রেশন করো

ফ্রি শুরু করো

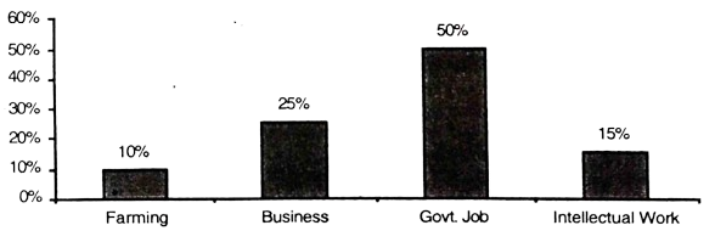
5.The graph below shows the choice of professions by different eduoated people. Describe the graph in 150 words. You should highlight and summarize the information given in the graph. question image

The graph below shows the choice of professions by different eduoated people. Describe the graph in 150 words. You should highlight and summarize the information given in the graph. question image

উত্তর ও ব্যাখ্যা দেখতে ফ্রি রেজিস্ট্রেশন করো

ফ্রি শুরু করো

6.The graph below shows shows 'Imports′from2000→2011.Describethegraphin150Imports^{\prime} from 2000 \to 2011. Describe the graph in 150 words. You should highlight and summarize the information given in the graph. Imports (Billion \$) question image

The graph below shows shows 'Imports′from2000→2011.Describethegraphin150Imports^{\prime} from 2000 \to 2011. Describe the graph in 150 words. You should highlight and summarize the information given in the graph. Imports (Billion \$) question image

উত্তর ও ব্যাখ্যা দেখতে ফ্রি রেজিস্ট্রেশন করো

ফ্রি শুরু করো

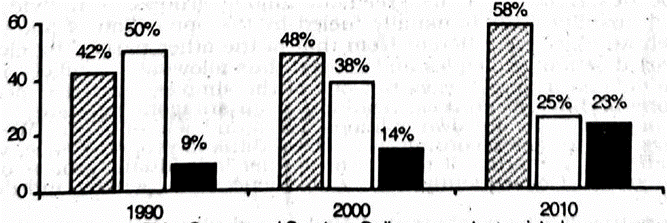
7.The barchart below shows the young people's changing attitude →\to pastimes. Describe the cˉhartinatleast80\bar chart in at least 80 words. You should highlight and analyze the information given in the graph. question image

The barchart below shows the young people's changing attitude →\to pastimes. Describe the cˉhartinatleast80\bar chart in at least 80 words. You should highlight and analyze the information given in the graph. question image

উত্তর ও ব্যাখ্যা দেখতে ফ্রি রেজিস্ট্রেশন করো

ফ্রি শুরু করো

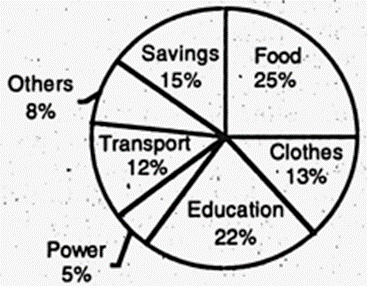
8.The pie chart shows the distribution (in percentage) of monthly income of a middle-class family in Bangladesh. Describe the chart in at least 80 words. question image

The pie chart shows the distribution (in percentage) of monthly income of a middle-class family in Bangladesh. Describe the chart in at least 80 words. question image

উত্তর ও ব্যাখ্যা দেখতে ফ্রি রেজিস্ট্রেশন করো

ফ্রি শুরু করো

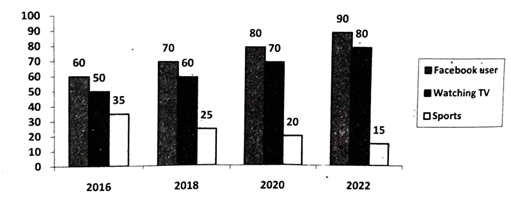
9.The graph below shows what percentage of time the college students in different areas of our country spend for pastime activities from 2016 →2022.Describethegraphin150\to 2022. Describe the graph in 150 words. question image

The graph below shows what percentage of time the college students in different areas of our country spend for pastime activities from 2016 →2022.Describethegraphin150\to 2022. Describe the graph in 150 words. question image

উত্তর ও ব্যাখ্যা দেখতে ফ্রি রেজিস্ট্রেশন করো

ফ্রি শুরু করো

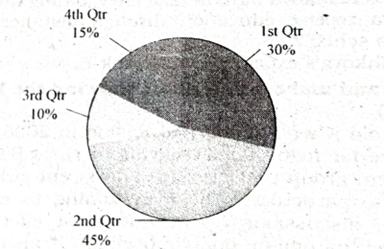
10.The pie chart below shows the percentages of transportation used by 800 students →come→\to come \to college. Describe the chart in 150 words. question image 1. Bus 30% 2. Bicycle 45% 3. Car 10% 4. Waling 15%

The pie chart below shows the percentages of transportation used by 800 students →come→\to come \to college. Describe the chart in 150 words. question image 1. Bus 30% 2. Bicycle 45% 3. Car 10% 4. Waling 15%

উত্তর ও ব্যাখ্যা দেখতে ফ্রি রেজিস্ট্রেশন করো

ফ্রি শুরু করো

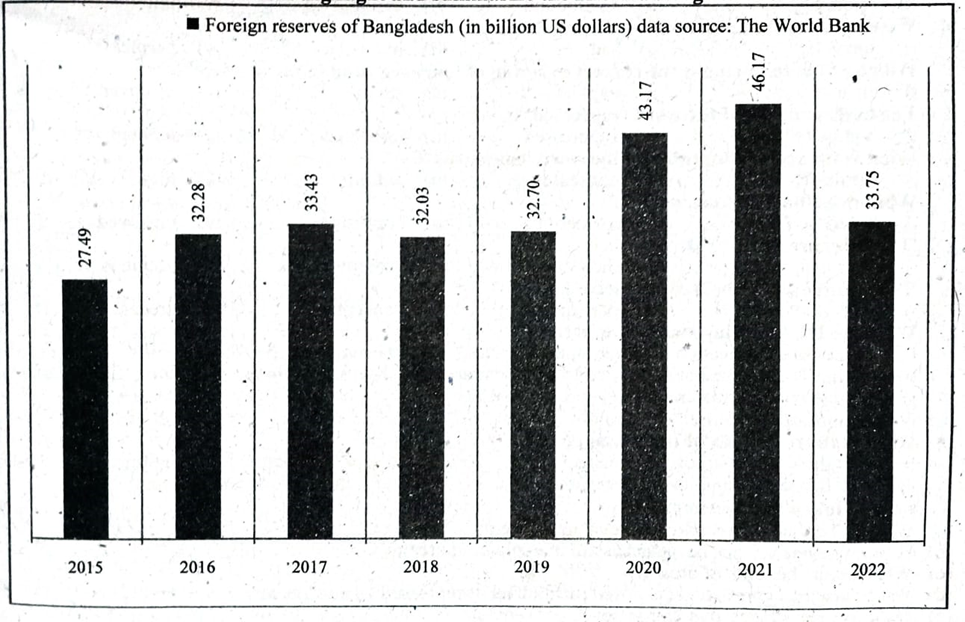
11.The graph/chart below shows the foreign reserves of Bangladesh from the year 2015 →2022.Describethechartin150\to 2022. Describe the chart in 150 words. You should highlight and summarize the information given in the chart. ■Foreign reserves of Bangladesh (in billion US dollars) data source: The World Bank question image

The graph/chart below shows the foreign reserves of Bangladesh from the year 2015 →2022.Describethechartin150\to 2022. Describe the chart in 150 words. You should highlight and summarize the information given in the chart. ■Foreign reserves of Bangladesh (in billion US dollars) data source: The World Bank question image

উত্তর ও ব্যাখ্যা দেখতে ফ্রি রেজিস্ট্রেশন করো

ফ্রি শুরু করো

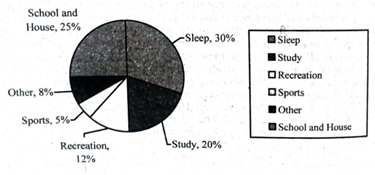
12.The pie chart below shows the time allocation of a student's daily activities. Describe the pie-chart in a least 150 words. question image

The pie chart below shows the time allocation of a student's daily activities. Describe the pie-chart in a least 150 words. question image

উত্তর ও ব্যাখ্যা দেখতে ফ্রি রেজিস্ট্রেশন করো

ফ্রি শুরু করো

আরো প্রশ্ন দেখো

আরো হাজারো প্রশ্ন + মডেল টেস্ট

ফ্রি রেজিস্ট্রেশন করো — ফেভারিট, AI টিউটর, লিডারবোর্ড ও অ্যানালিটিক্স আনলক করো।