শেয়ারFacebookWhatsApp

The graph below shows the young people's changing attitude [গণিত] pastimes. Describe the graph in 150 words. You should highlight and summarize the information given in the chart. Young people's changing attitude [গণিত] pastimes [চিত্র]

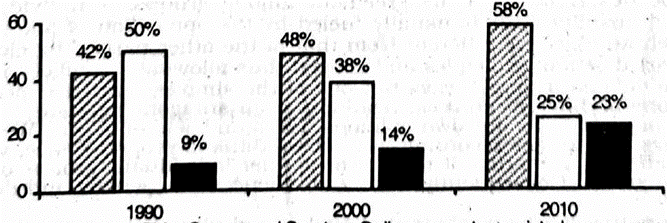
উত্তর: Young people's changing attitude to pastimes With the passage of time, young people's pastime activities are also changing. Here the bar chart shows different types of pastimes of the young people of Bangladesh. As we see in the chart in 1990, 41% of the young people watched TV, 50% participated in games and sports, and 9% got themselves engaged in online or computer-assisted programmes as their leisure activities. After a decade, that is to say in 2000, the number of TV viewers increased to 48%, but the number of young people participating in games and sports came down to 38%. In the same year, the percentage of young people spendin people spending time on online computer-based programmes rose to 14%. In 2010, the number of TV viewers increased further and stood at 52%, while the percentage of participants (অংশগ্রহণকারী) in games and sports decreased to 25%. But the percentage of the students spending time on online programmes increased to 23%. Overall, in compliance with available facilities, young people are choosing their pastime activities variedly on the Internet. Actually, the facilities for outdoor games and sports are getting reduced, and the students are getting inclined (ঝোঁকা) to indoor pastime pastime activities. Thus, our young generations are stepping into the e-world. বাংলা অনুবাদ: তরুণদের অবসর কাটানোর পরিবর্তিত অভ্যাস সময়ের সঙ্গে সঙ্গে তরুণদের অবসর কাটানোর ধরণও পরিবর্তিত হচ্ছে। এখানে যে বার চার্টটি উপস্থাপন করা হয়েছে, তা বাংলাদেশের তরুণদের বিভিন্ন ধরণের অবসর কাটানোর উপায়কে তুলে ধরেছে। চার্ট অনুযায়ী, ১৯৯০ সালে ৪১% তরুণ টেলিভিশন দেখত, ৫০% তরুণ খেলাধুলায় অংশগ্রহণ করত এবং মাত্র ৯% তরুণ অনলাইন বা কম্পিউটার-ভিত্তিক প্রোগ্রামে যুক্ত ছিল অবসর কাটানোর মাধ্যম হিসেবে। এক দশক পর, অর্থাৎ ২০০০ সালে টেলিভিশন দেখার হার বেড়ে ৪৮% হয়, কিন্তু খেলাধুলায় অংশগ্রহণকারীর হার কমে ৩৮%-এ দাঁড়ায়। একই সময়ে অনলাইন বা কম্পিউটার-ভিত্তিক প্রোগ্রামে সময় কাটানো তরুণদের সংখ্যা বেড়ে দাঁড়ায় ১৪%। ২০১০ সালে টেলিভিশন দেখার হার আরও বেড়ে দাঁড়ায় ৫২%, তবে খেলাধুলায় অংশগ্রহণের হার নেমে আসে ২৫%-এ। অন্যদিকে, অনলাইন প্রোগ্রামে সময় কাটানো শিক্ষার্থীর হার বেড়ে দাঁড়ায় ২৩%। সার্বিকভাবে, সহজলভ্য প্রযুক্তিগত সুবিধার সঙ্গে তাল মিলিয়ে তরুণরা বিভিন্ন অনলাইন কার্যক্রমকে অবসর কাটানোর মাধ্যম হিসেবে বেছে নিচ্ছে। বাস্তবিক অর্থে, বাইরের খেলাধুলার সুযোগ-সুবিধা দিন দিন কমে যাচ্ছে এবং শিক্ষার্থীরা ঘরোয়া অবসরের প্রতি বেশি ঝোঁক দেখাচ্ছে। ফলে, আমাদের তরুণ প্রজন্ম ধীরে ধীরে ই-জগতে পা রাখছে।

HSC English 1st Paper Writing : Interpreting graph/chart CQ — Prosthuti প্রশ্নব্যাংক

HSC · English 1st Paper · Writing : Interpreting graph/chart · সৃজনশীল

The graph below shows the young people's changing attitude →\to pastimes. Describe the graph in 150 words. You should highlight and summarize the information given in the chart. Young people's changing attitude →pastimes\to pastimes question image

উত্তর

Young people's changing attitude to pastimes With the passage of time, young people's pastime activities are also changing. Here the bar chart shows different types of pastimes of the young people of Bangladesh. As we see in the chart in 1990, 41% of the young people watched TV, 50% participated in games and sports, and 9% got themselves engaged in online or computer-assisted programmes as their leisure activities. After a decade, that is to say in 2000, the number of TV viewers increased to 48%, but the number of young people participating in games and sports came down to 38%. In the same year, the percentage of young people spendin people spending time on online computer-based programmes rose to 14%. In 2010, the number of TV viewers increased further and stood at 52%, while the percentage of participants (অংশগ্রহণকারী) in games and sports decreased to 25%. But the percentage of the students spending time on online programmes increased to 23%. Overall, in compliance with available facilities, young people are choosing their pastime activities variedly on the Internet. Actually, the facilities for outdoor games and sports are getting reduced, and the students are getting inclined (ঝোঁকা) to indoor pastime pastime activities. Thus, our young generations are stepping into the e-world. বাংলা অনুবাদ: তরুণদের অবসর কাটানোর পরিবর্তিত অভ্যাস সময়ের সঙ্গে সঙ্গে তরুণদের অবসর কাটানোর ধরণও পরিবর্তিত হচ্ছে। এখানে যে বার চার্টটি উপস্থাপন করা হয়েছে, তা বাংলাদেশের তরুণদের বিভিন্ন ধরণের অবসর কাটানোর উপায়কে তুলে ধরেছে। চার্ট অনুযায়ী, ১৯৯০ সালে ৪১% তরুণ টেলিভিশন দেখত, ৫০% তরুণ খেলাধুলায় অংশগ্রহণ করত এবং মাত্র ৯% তরুণ অনলাইন বা কম্পিউটার-ভিত্তিক প্রোগ্রামে যুক্ত ছিল অবসর কাটানোর মাধ্যম হিসেবে। এক দশক পর, অর্থাৎ ২০০০ সালে টেলিভিশন দেখার হার বেড়ে ৪৮% হয়, কিন্তু খেলাধুলায় অংশগ্রহণকারীর হার কমে ৩৮%-এ দাঁড়ায়। একই সময়ে অনলাইন বা কম্পিউটার-ভিত্তিক প্রোগ্রামে সময় কাটানো তরুণদের সংখ্যা বেড়ে দাঁড়ায় ১৪%। ২০১০ সালে টেলিভিশন দেখার হার আরও বেড়ে দাঁড়ায় ৫২%, তবে খেলাধুলায় অংশগ্রহণের হার নেমে আসে ২৫%-এ। অন্যদিকে, অনলাইন প্রোগ্রামে সময় কাটানো শিক্ষার্থীর হার বেড়ে দাঁড়ায় ২৩%। সার্বিকভাবে, সহজলভ্য প্রযুক্তিগত সুবিধার সঙ্গে তাল মিলিয়ে তরুণরা বিভিন্ন অনলাইন কার্যক্রমকে অবসর কাটানোর মাধ্যম হিসেবে বেছে নিচ্ছে। বাস্তবিক অর্থে, বাইরের খেলাধুলার সুযোগ-সুবিধা দিন দিন কমে যাচ্ছে এবং শিক্ষার্থীরা ঘরোয়া অবসরের প্রতি বেশি ঝোঁক দেখাচ্ছে। ফলে, আমাদের তরুণ প্রজন্ম ধীরে ধীরে ই-জগতে পা রাখছে।
HSCEnglish 1st PaperWriting : Interpreting graph/chart
12টি সম্পর্কিত প্রশ্ন — ব্যাখ্যা লকড

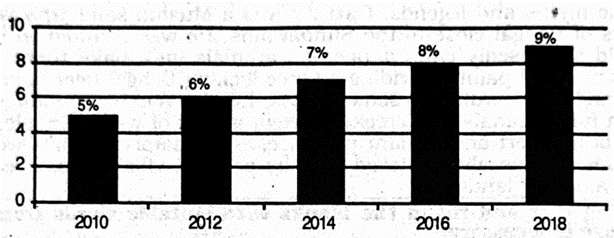
1.The graph shows "The economic growth rate of Bangladesh from 2010 →2018\to 2018 ". Describe in 150 words. question image

The graph shows "The economic growth rate of Bangladesh from 2010 →2018\to 2018 ". Describe in 150 words. question image

উত্তর ও ব্যাখ্যা দেখতে ফ্রি রেজিস্ট্রেশন করো

ফ্রি শুরু করো

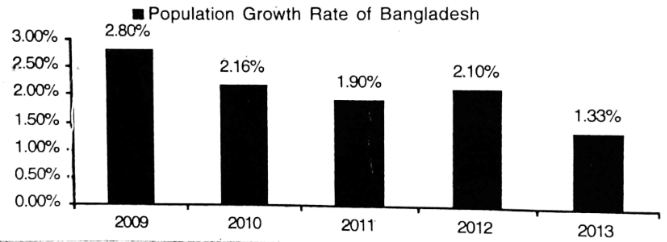
2.The graph below shows "Population Growth Rate" from 2009 →2013.Describethegraphinafleast80wordshighlightingtheinformationgiveninthe\to 2013. Describe the graph in af least 80 words highlighting the information given in the graph. question image

The graph below shows "Population Growth Rate" from 2009 →2013.Describethegraphinafleast80wordshighlightingtheinformationgiveninthe\to 2013. Describe the graph in af least 80 words highlighting the information given in the graph. question image

উত্তর ও ব্যাখ্যা দেখতে ফ্রি রেজিস্ট্রেশন করো

ফ্রি শুরু করো

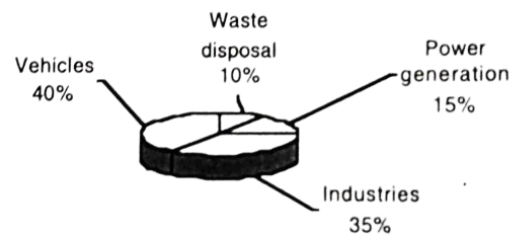
3.Look at the chart below. It shows the sources of air pollution in Dhaka. Now, analyze the chart in at least 80 words focusing the main aspects. question image

Look at the chart below. It shows the sources of air pollution in Dhaka. Now, analyze the chart in at least 80 words focusing the main aspects. question image

উত্তর ও ব্যাখ্যা দেখতে ফ্রি রেজিস্ট্রেশন করো

ফ্রি শুরু করো

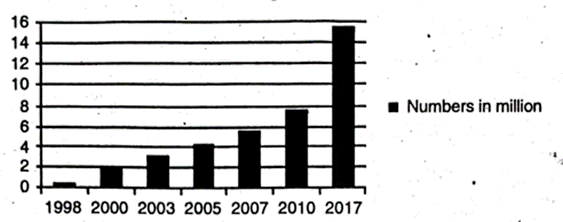
4.Look at the following graph. It shows the number of mobile phone users in Bangladesh. The point is shows in mllion. Now, describe the graph. question image

Look at the following graph. It shows the number of mobile phone users in Bangladesh. The point is shows in mllion. Now, describe the graph. question image

উত্তর ও ব্যাখ্যা দেখতে ফ্রি রেজিস্ট্রেশন করো

ফ্রি শুরু করো

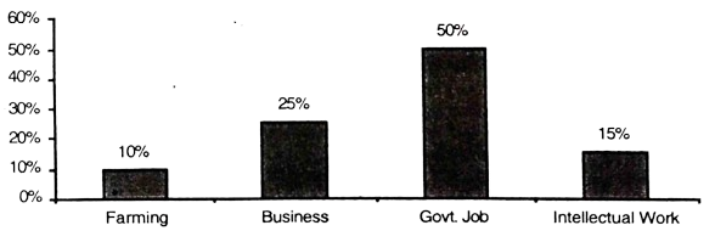
5.The graph below shows the choice of professions by different eduoated people. Describe the graph in 150 words. You should highlight and summarize the information given in the graph. question image

The graph below shows the choice of professions by different eduoated people. Describe the graph in 150 words. You should highlight and summarize the information given in the graph. question image

উত্তর ও ব্যাখ্যা দেখতে ফ্রি রেজিস্ট্রেশন করো

ফ্রি শুরু করো

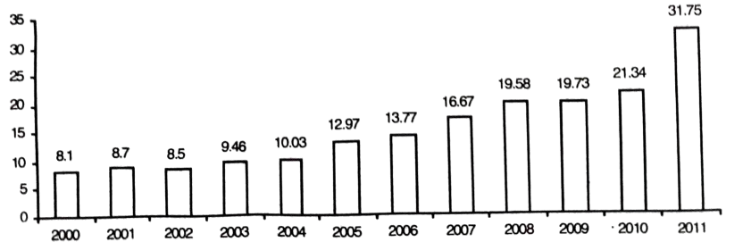
6.The graph below shows shows 'Imports′from2000→2011.Describethegraphin150Imports^{\prime} from 2000 \to 2011. Describe the graph in 150 words. You should highlight and summarize the information given in the graph. Imports (Billion \$) question image

The graph below shows shows 'Imports′from2000→2011.Describethegraphin150Imports^{\prime} from 2000 \to 2011. Describe the graph in 150 words. You should highlight and summarize the information given in the graph. Imports (Billion \$) question image

উত্তর ও ব্যাখ্যা দেখতে ফ্রি রেজিস্ট্রেশন করো

ফ্রি শুরু করো

7.The barchart below shows the young people's changing attitude →\to pastimes. Describe the cˉhartinatleast80\bar chart in at least 80 words. You should highlight and analyze the information given in the graph. question image

The barchart below shows the young people's changing attitude →\to pastimes. Describe the cˉhartinatleast80\bar chart in at least 80 words. You should highlight and analyze the information given in the graph. question image

উত্তর ও ব্যাখ্যা দেখতে ফ্রি রেজিস্ট্রেশন করো

ফ্রি শুরু করো

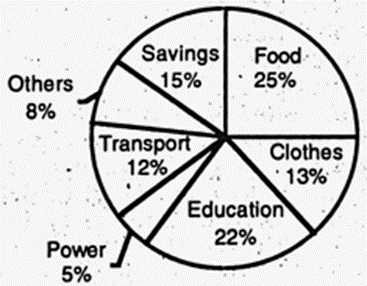
8.The pie chart shows the distribution (in percentage) of monthly income of a middle-class family in Bangladesh. Describe the chart in at least 80 words. question image

The pie chart shows the distribution (in percentage) of monthly income of a middle-class family in Bangladesh. Describe the chart in at least 80 words. question image

উত্তর ও ব্যাখ্যা দেখতে ফ্রি রেজিস্ট্রেশন করো

ফ্রি শুরু করো

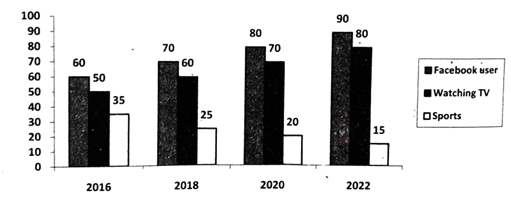
9.The graph below shows what percentage of time the college students in different areas of our country spend for pastime activities from 2016 →2022.Describethegraphin150\to 2022. Describe the graph in 150 words. question image

The graph below shows what percentage of time the college students in different areas of our country spend for pastime activities from 2016 →2022.Describethegraphin150\to 2022. Describe the graph in 150 words. question image

উত্তর ও ব্যাখ্যা দেখতে ফ্রি রেজিস্ট্রেশন করো

ফ্রি শুরু করো

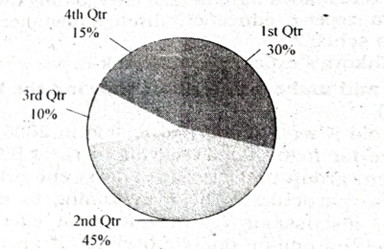
10.The pie chart below shows the percentages of transportation used by 800 students →come→\to come \to college. Describe the chart in 150 words. question image 1. Bus 30% 2. Bicycle 45% 3. Car 10% 4. Waling 15%

The pie chart below shows the percentages of transportation used by 800 students →come→\to come \to college. Describe the chart in 150 words. question image 1. Bus 30% 2. Bicycle 45% 3. Car 10% 4. Waling 15%

উত্তর ও ব্যাখ্যা দেখতে ফ্রি রেজিস্ট্রেশন করো

ফ্রি শুরু করো

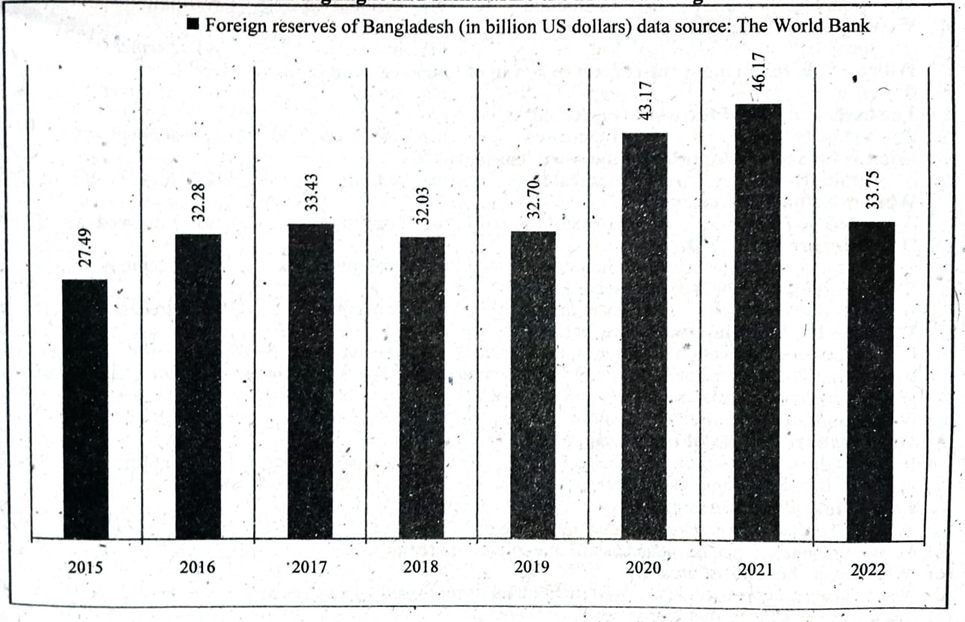
11.The graph/chart below shows the foreign reserves of Bangladesh from the year 2015 →2022.Describethechartin150\to 2022. Describe the chart in 150 words. You should highlight and summarize the information given in the chart. ■Foreign reserves of Bangladesh (in billion US dollars) data source: The World Bank question image

The graph/chart below shows the foreign reserves of Bangladesh from the year 2015 →2022.Describethechartin150\to 2022. Describe the chart in 150 words. You should highlight and summarize the information given in the chart. ■Foreign reserves of Bangladesh (in billion US dollars) data source: The World Bank question image

উত্তর ও ব্যাখ্যা দেখতে ফ্রি রেজিস্ট্রেশন করো

ফ্রি শুরু করো

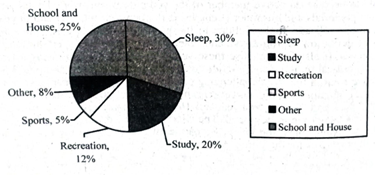
12.The pie chart below shows the time allocation of a student's daily activities. Describe the pie-chart in a least 150 words. question image

The pie chart below shows the time allocation of a student's daily activities. Describe the pie-chart in a least 150 words. question image

উত্তর ও ব্যাখ্যা দেখতে ফ্রি রেজিস্ট্রেশন করো

ফ্রি শুরু করো

আরো প্রশ্ন দেখো

আরো হাজারো প্রশ্ন + মডেল টেস্ট

ফ্রি রেজিস্ট্রেশন করো — ফেভারিট, AI টিউটর, লিডারবোর্ড ও অ্যানালিটিক্স আনলক করো।