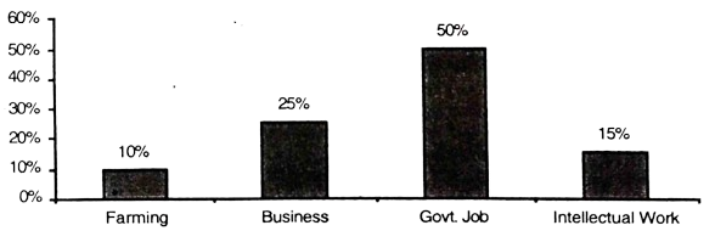
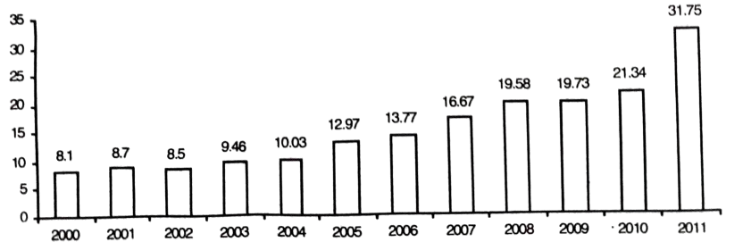
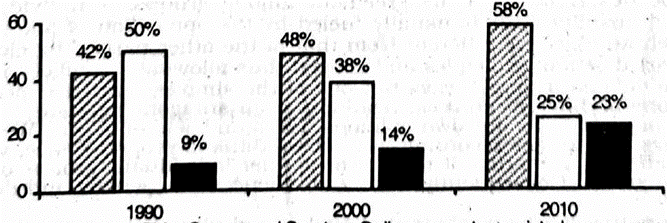
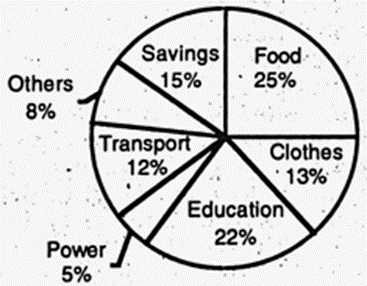
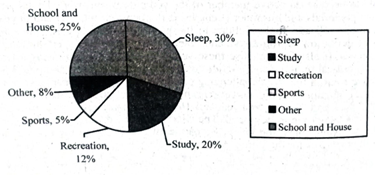
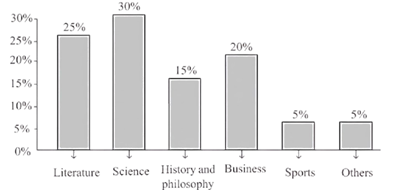
The graph shows the percentage of different types of books preserved in a college library. Analyze the graph in about 150 words. [চিত্র]
উত্তর: The provided bar graph illustrates the distribution of various book types within a college library. The data reveals that Science books constitute the largest portion, accounting for 30% of the total collection. Following closely are Literature books, which make up 25% of the library's holdings. History and Philosophy books represent 15% of the collection, while Business books account for 20%. The categories of Sports and "Others" each comprise the smallest percentage, at 5% each. The graph highlights a clear emphasis on academic subjects, with Science, Literature, and Business books making up a significant majority of the library's resources. The relatively small percentage of Sports and "Others" books suggests a focus on core academic disciplines over recreational or miscellaneous topics.
HSC English 1st Paper Writing : Interpreting graph/chart CQ — Prosthuti প্রশ্নব্যাংক
HSC · English 1st Paper · Writing : Interpreting graph/chart · সৃজনশীল
The graph shows the percentage of different types of books preserved in a college library. Analyze the graph in about 150 words.
উত্তর