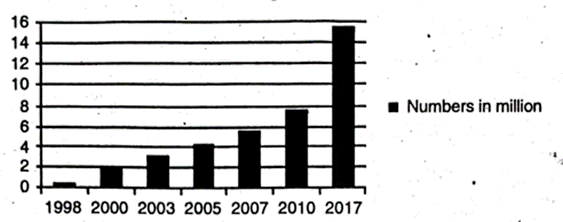
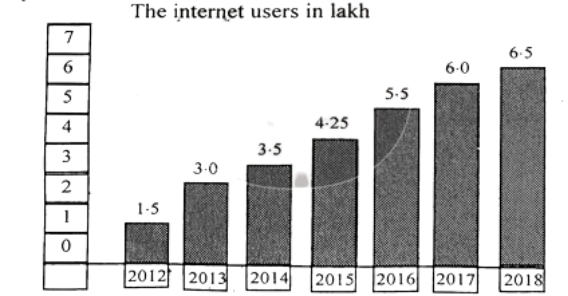
The graph shows "the internet users" from 2012 [গণিত] 2018. Describe the graph in at least 80 words. [চিত্র]
উত্তর: Increasing number of Internet users in Bangladesh: 2012-2018 (in lakh) Here the given graph embodies the findings of a survey conducted on the number of Internet users over a period from 2012 [গণিত] 2018. The figures in the graph are expressed in lakh. As per the information on the graph, in the [গণিত] year mentioned in the survey that is in 2012, the Internet users were 1.5 lakh which rose [গণিত] 3,0 lakh in 2013. The users of Internet kept on increasing. As such the next consecutive five years namely 2014, 2015, 2016, 2017 and 2018 show the numbers of Internet users [গণিত] be 1.5, 3.0, 3.5, 4.25, 5.5, 6.0 and 6.5 lakh respectively. On a close look at the graph, it is clear that Interent users are increasing in number day by day. In fact, in modern globalized world, the importance of Internet is immeasurable. People from all walks of life now use Internet [গণিত] get information on wide range of subjects. It is helping them greatly.
HSC English 1st Paper Writing : Interpreting graph/chart CQ — Prosthuti প্রশ্নব্যাংক
HSC · English 1st Paper · Writing : Interpreting graph/chart · সৃজনশীল
The graph shows "the internet users" from 2012 words.
উত্তর