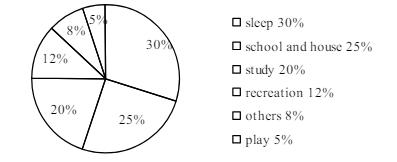
The pie chart below shows the favourite activities of 600 students studying in class XII. Describe the chart in at least 80 words. You should highlight and summarize the information given in the chart.
উত্তর: The favourite activities of 600 students studying in class XII The given pie chart highlights the favourite activities of 600 students of class XII, segmented (বিভক্ত) into swimming, walking, cycling, cricket and others. Here we see that 30% of the students like walking. Playing cricket is the favourite activity of 25% of the students of the class. 20% of the students prefer swimming as their favourite activity. The percentage of the students who like cycling as their favourite activity is 15%. The remaining 10% of the students do other things as their favourite activity. Thus, it is clear from the information of the pie chart that walking, playing cricket, swimming and cycling occupy the first, second, third and fourth position respectively as the favourite activities of the students. The choices of the students in respect of their favourite activities are appreciable (বোধগম্য) since these activities are helpful to maintain their sound physique. বাংলা অনুবাদ: প্রদত্ত পাই চার্টটি দ্বাদশ শ্রেণির ৬০০ শিক্ষার্থীর প্রিয় কর্মকাণ্ডকে বিভিন্ন ভাগে বিভক্ত করে উপস্থাপন করেছে—যথা: সাঁতার কাটা, হাঁটা, সাইক্লিং, ক্রিকেট খেলা এবং অন্যান্য। এখানে আমরা দেখি যে ৩০% শিক্ষার্থী হাঁটতে পছন্দ করে। ২৫% শিক্ষার্থীর প্রিয় কর্মকাণ্ড ক্রিকেট খেলা। ২০% শিক্ষার্থী সাঁতার কাটাকে তাদের প্রিয় কর্মকাণ্ড হিসেবে বেছে নিয়েছে। সাইক্লিং পছন্দ করে ১৫% শিক্ষার্থী। বাকি ১০% শিক্ষার্থী অন্যান্য কর্মকাণ্ডে যুক্ত থাকে যা তারা প্রিয় হিসেবে বিবেচনা করে। সুতরাং, পাই চার্টের তথ্য বিশ্লেষণ করলে দেখা যায় যে হাঁটা, ক্রিকেট খেলা, সাঁতার কাটা ও সাইক্লিং—এই চারটি কর্মকাণ্ড যথাক্রমে প্রথম, দ্বিতীয়, তৃতীয় ও চতুর্থ অবস্থানে রয়েছে শিক্ষার্থীদের প্রিয়তার বিচারে। শিক্ষার্থীদের প্রিয় কর্মকাণ্ড হিসেবে এই পছন্দগুলো বোধগম্য ও প্রশংসনীয়, কারণ এসব কর্মকাণ্ড তাদের সুস্থ শরীর বজায় রাখতে সহায়ক।
HSC English 1st Paper Writing : Interpreting graph/chart CQ — Prosthuti প্রশ্নব্যাংক
HSC · English 1st Paper · Writing : Interpreting graph/chart · সৃজনশীল
The pie chart below shows the favourite activities of 600 students …
সিলেট এমসি কলেজ · 2025
উত্তর