শেয়ারFacebookWhatsApp

The pie-chart below shows the percentage of a family's household income distributed into different categories. Describe the pie-chart in 150 words:— [চিত্র]

উত্তর: The distribution of a middle-class family's monthly income into different categories (%) The given pie chart embodies the outcome of a survey carried out on the percentages of monthly expenses of a particular middle class family in Bangladesh. The chart shows that the family spends 28% of the total monthly income on food items. The family spends 25% of the total income for education purpose. The family spends 10% and 12% on the purchase of clothes and the use of transport respectively. Likewise, the family spends 5% and 8% on the consumption of power including electricity and miscellaneous items for family use respectively. The family, after meeting all necessities, saves 12% of the total monthly income. A close study of the chart reveals that the family spends the highest amount of monthly income (28%) on food items and the lowest amount on the consumption of power. The family is an ideal one, because it allots a reasonable amount (25%) on the education of the children. Finally, the family is aware of its future prospect and so it saves a considerable amount (12%). বাংলা অনুবাদঃ প্রদত্ত পাই চার্টটি বাংলাদেশের একটি নির্দিষ্ট মধ্যবিত্ত পরিবারের মাসিক খরচের শতাংশের উপর ভিত্তি করে পরিচালিত জরিপের ফলাফল উপস্থাপন করে। চার্টে দেখা যায় যে পরিবারটি মাসিক মোট আয়ের ২৮% খাবার সামগ্রীর উপর ব্যয় করে। শিক্ষার জন্য পরিবারটি মোট আয়ের ২৫% ব্যয় করে। পোশাক কেনার জন্য ১০% এবং পরিবহনের জন্য ১২% খরচ করে। একইভাবে, বিদ্যুৎসহ বিদ্যুতের খরচের জন্য ৫% এবং পরিবারের অন্যান্য প্রয়োজনীয় সামগ্রীর জন্য ৮% ব্যয় করে। প্রয়োজনীয় সকল খরচ মেটানোর পর, পরিবারটি মাসিক মোট আয়ের ১২% সঞ্চয় করে। চার্টটি ঘনিষ্ঠভাবে বিশ্লেষণ করলে দেখা যায় যে পরিবারটি মাসিক আয়ের সর্বাধিক অংশ (২৮%) খাবার সামগ্রীর জন্য ব্যয় করে এবং সর্বনিম্ন অংশ বিদ্যুতের জন্য ব্যয় করে। পরিবারটি একটি আদর্শ পরিবার, কারণ এটি শিশুদের শিক্ষার জন্য যুক্তিসঙ্গত পরিমাণ (২৫%) বরাদ্দ করে। সর্বশেষে, পরিবারটি ভবিষ্যৎ পরিকল্পনা সম্পর্কে সচেতন এবং তাই এটি উল্লেখযোগ্য পরিমাণ (১২%) সঞ্চয় করে।

HSC English 1st Paper Writing : Interpreting graph/chart CQ — Prosthuti প্রশ্নব্যাংক

HSC · English 1st Paper · Writing : Interpreting graph/chart · সৃজনশীল

The pie-chart below shows the percentage of a family's household in…

Barisal Board · 2017

উত্তর

The distribution of a middle-class family's monthly income into different categories (%) The given pie chart embodies the outcome of a survey carried out on the percentages of monthly expenses of a particular middle class family in Bangladesh. The chart shows that the family spends 28% of the total monthly income on food items. The family spends 25% of the total income for education purpose. The family spends 10% and 12% on the purchase of clothes and the use of transport respectively. Likewise, the family spends 5% and 8% on the consumption of power including electricity and miscellaneous items for family use respectively. The family, after meeting all necessities, saves 12% of the total monthly income. A close study of the chart reveals that the family spends the highest amount of monthly income (28%) on food items and the lowest amount on the consumption of power. The family is an ideal one, because it allots a reasonable amount (25%) on the education of the children. Finally, the family is aware of its future prospect and so it saves a considerable amount (12%). বাংলা অনুবাদঃ প্রদত্ত পাই চার্টটি বাংলাদেশের একটি নির্দিষ্ট মধ্যবিত্ত পরিবারের মাসিক খরচের শতাংশের উপর ভিত্তি করে পরিচালিত জরিপের ফলাফল উপস্থাপন করে। চার্টে দেখা যায় যে পরিবারটি মাসিক মোট আয়ের ২৮% খাবার সামগ্রীর উপর ব্যয় করে। শিক্ষার জন্য পরিবারটি মোট আয়ের ২৫% ব্যয় করে। পোশাক কেনার জন্য ১০% এবং পরিবহনের জন্য ১২% খরচ করে। একইভাবে, বিদ্যুৎসহ বিদ্যুতের খরচের জন্য ৫% এবং পরিবারের অন্যান্য প্রয়োজনীয় সামগ্রীর জন্য ৮% ব্যয় করে। প্রয়োজনীয় সকল খরচ মেটানোর পর, পরিবারটি মাসিক মোট আয়ের ১২% সঞ্চয় করে। চার্টটি ঘনিষ্ঠভাবে বিশ্লেষণ করলে দেখা যায় যে পরিবারটি মাসিক আয়ের সর্বাধিক অংশ (২৮%) খাবার সামগ্রীর জন্য ব্যয় করে এবং সর্বনিম্ন অংশ বিদ্যুতের জন্য ব্যয় করে। পরিবারটি একটি আদর্শ পরিবার, কারণ এটি শিশুদের শিক্ষার জন্য যুক্তিসঙ্গত পরিমাণ (২৫%) বরাদ্দ করে। সর্বশেষে, পরিবারটি ভবিষ্যৎ পরিকল্পনা সম্পর্কে সচেতন এবং তাই এটি উল্লেখযোগ্য পরিমাণ (১২%) সঞ্চয় করে।
HSCEnglish 1st PaperWriting : Interpreting graph/chartBarisal
12টি সম্পর্কিত প্রশ্ন — উত্তর ও ব্যাখ্যা লকড

1.সৃজনশীল প্রশ্ন · Sylhet

Sylhet Board · 2017

The pie chart below shows the percentages of transportation used by 800 students come\to come \to college. Describe the chart in 150 words. question image

উত্তর ও ব্যাখ্যা দেখতে ফ্রি রেজিস্ট্রেশন করো

ফ্রি শুরু করো

2.সৃজনশীল প্রশ্ন · Sylhet

Sylhet Board · 2017

The pie chart below shows the percentages of transportation used by 800 students come\to come \to college. Describe the chart in 150 words. question image

উত্তর ও ব্যাখ্যা দেখতে ফ্রি রেজিস্ট্রেশন করো

ফ্রি শুরু করো

3.সৃজনশীল প্রশ্ন · Chittagong

Chittagong Board · 2017

The graph chart shows the choice of profession by educated people in our country. Describe the graph in at least 150 words:—

উত্তর ও ব্যাখ্যা দেখতে ফ্রি রেজিস্ট্রেশন করো

ফ্রি শুরু করো

4.সৃজনশীল প্রশ্ন · Chittagong

Chittagong Board · 2017

The graph chart shows the choice of profession by educated people in our country. Describe the graph in at least 150 words:—

উত্তর ও ব্যাখ্যা দেখতে ফ্রি রেজিস্ট্রেশন করো

ফ্রি শুরু করো

5.সৃজনশীল প্রশ্ন · Comilla

Comilla Board · 2017

The pie chart below shows the time allocation of studentsdailystudents^{\prime} daily activities. Analyse the chart focussing the main preoccupations. (At least in 150 words) question image

উত্তর ও ব্যাখ্যা দেখতে ফ্রি রেজিস্ট্রেশন করো

ফ্রি শুরু করো

6.সৃজনশীল প্রশ্ন · Comilla

Comilla Board · 2017

The pie chart below shows the time allocation of studentsdailystudents^{\prime} daily activities. Analyse the chart focussing the main preoccupations. (At least in 150 words) question image

উত্তর ও ব্যাখ্যা দেখতে ফ্রি রেজিস্ট্রেশন করো

ফ্রি শুরু করো

7.সৃজনশীল প্রশ্ন · Jessore

Jessore Board · 2017

The graph below shows "The number of people living below the poverty line from 1995 to 2010". Describe the graph in 150 words. You should highlight and summarize the information given in the graph.

উত্তর ও ব্যাখ্যা দেখতে ফ্রি রেজিস্ট্রেশন করো

ফ্রি শুরু করো

8.সৃজনশীল প্রশ্ন · Jessore

Jessore Board · 2017

The graph below shows "The number of people living below the poverty line from 1995 to 2010". Describe the graph in 150 words. You should highlight and summarize the information given in the graph.

উত্তর ও ব্যাখ্যা দেখতে ফ্রি রেজিস্ট্রেশন করো

ফ্রি শুরু করো

9.সৃজনশীল প্রশ্ন · Dinajpur

Dinajpur Board · 2017

Look at the chart below. It shows the sources of air pollution in a city. Now, analyze the chart in at least 150 words focusing the main aspects.

উত্তর ও ব্যাখ্যা দেখতে ফ্রি রেজিস্ট্রেশন করো

ফ্রি শুরু করো

10.সৃজনশীল প্রশ্ন · Dinajpur

Dinajpur Board · 2017

Look at the chart below. It shows the sources of air pollution in a city. Now, analyze the chart in at least 150 words focusing the main aspects.

উত্তর ও ব্যাখ্যা দেখতে ফ্রি রেজিস্ট্রেশন করো

ফ্রি শুরু করো

11.সৃজনশীল প্রশ্ন · Rajshahi

Rajshahi Board · 2017

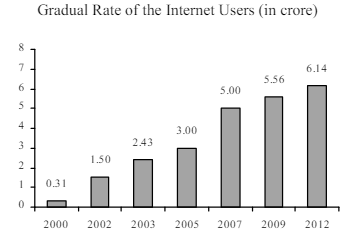
The graph below shows the gradual rate of the internet users in Bangladesh. Describe the graph in at least 150 words. You should highlight the information and report the main features given in the graph. question image

উত্তর ও ব্যাখ্যা দেখতে ফ্রি রেজিস্ট্রেশন করো

ফ্রি শুরু করো

12.সৃজনশীল প্রশ্ন · Rajshahi

Rajshahi Board · 2017

The graph below shows the gradual rate of the internet users in Bangladesh. Describe the graph in at least 150 words. You should highlight the information and report the main features given in the graph. question image

উত্তর ও ব্যাখ্যা দেখতে ফ্রি রেজিস্ট্রেশন করো

ফ্রি শুরু করো

আরো প্রশ্ন দেখো

আরো হাজারো প্রশ্ন + মডেল টেস্ট

ফ্রি রেজিস্ট্রেশন করো — ফেভারিট, AI টিউটর, লিডারবোর্ড ও অ্যানালিটিক্স আনলক করো।