শেয়ারFacebookWhatsApp

The pie chart below shows the time allocation of students [গণিত] daily activities. Analyse the chart focussing the main preoccupations. (At least in 150 words) [চিত্র]

উত্তর: The time allocation of students [গণিত] daily activities The given pie chart perfectly describes the time allocation of students [গণিত] daily activities. [গণিত] be a good student and [গণিত] lead a healthy life, one should maintain a routine. Study, play, recreation, school and home, sleep, etc. are the parts of a student's daily activities. As per the information contained in the pie chart, we find that a student needs [গণিত] spend 25% time of a day at school and home. It shows that a student should spend 20% time of a day in his/her study. A student needs [গণিত] spend recreational time which is not more than 12% of the total time of a day. [গণিত] keep fit, a student needs physical exercise. Sport is one of them. In the afternoon, a student should play for some time which is helpful [গণিত] make the body strong and healthy and 5% time of a day is better for the allotment of game and sports. A student should spend 8% of the time of a day in doing other activities: From dawn [গণিত] dusk, a student is busy with his/her study, work, etc. A sound sleep is necessary for every human being. [গণিত] get rid of fatigue and tension, sleeping is the best medicine. So, [গণিত] sleep 30% of the total time of a day seems [গণিত] be optimum. However, if students maintain the above time allocation, they must attain success in life. বাংলা অনুবাদঃ প্রদত্ত পাই চার্টটি শিক্ষার্থীদের দৈনন্দিন কার্যক্রমের সময় বণ্টনকে নিখুঁতভাবে বর্ণনা করে। একজন ভালো শিক্ষার্থী হতে এবং সুস্থ জীবনযাপন করতে, একজন শিক্ষার্থীর রুটিন মেনে চলা প্রয়োজন। পড়াশোনা, খেলাধুলা, বিনোদন, স্কুল এবং বাড়ি, ঘুম ইত্যাদি শিক্ষার্থীদের দৈনন্দিন কার্যক্রমের অংশ। পাই চার্টের তথ্য অনুযায়ী, দেখা যায় একজন শিক্ষার্থীকে তার দিনের ২৫% সময় স্কুল এবং বাড়িতে ব্যয় করতে হয়। চার্ট থেকে বোঝা যায় যে একজন শিক্ষার্থীর পড়াশোনায় দিনের ২০% সময় ব্যয় করা উচিত। একজন শিক্ষার্থীর বিনোদনের জন্য সময় প্রয়োজন, যা দিনের মোট সময়ের ১২%-এর বেশি নয়। শারীরিকভাবে সুস্থ থাকতে শিক্ষার্থীর শারীরিক ব্যায়ামের প্রয়োজন। খেলাধুলা এর একটি গুরুত্বপূর্ণ অংশ। বিকেলে শিক্ষার্থীর কিছু সময় খেলাধুলায় ব্যয় করা উচিত, যা শরীরকে মজবুত এবং স্বাস্থ্যকর করতে সাহায্য করে। এ জন্য দিনের ৫% সময় খেলাধুলার জন্য বরাদ্দ করা উত্তম। একজন শিক্ষার্থীকে তার দিনের ৮% সময় অন্যান্য কাজে ব্যয় করা উচিত। ভোর থেকে সন্ধ্যা পর্যন্ত একজন শিক্ষার্থী তার পড়াশোনা এবং অন্যান্য কাজ নিয়ে ব্যস্ত থাকে। প্রতিটি মানুষের জন্য একটি সুষ্ঠু ঘুম অত্যন্ত প্রয়োজনীয়। ক্লান্তি এবং মানসিক চাপ দূর করতে ঘুম হলো সেরা ওষুধ। তাই দিনের মোট সময়ের ৩০% ঘুমানোর জন্য বরাদ্দ করা যথাযথ। তবে, যদি শিক্ষার্থীরা উপরের সময় বণ্টন অনুসরণ করে, তবে তারা জীবনে অবশ্যই সাফল্য অর্জন করবে।

HSC English 1st Paper Writing : Interpreting graph/chart CQ — Prosthuti প্রশ্নব্যাংক

HSC · English 1st Paper · Writing : Interpreting graph/chart · সৃজনশীল

The pie chart below shows the time allocation of students daily ac…

Comilla Board · 2017

উত্তর

The time allocation of
studentsdailyactivitiesThegivenpiechartperfectlydescribesthetimeallocationofstudentsdailystudents^{\prime} daily activities The given pie chart perfectly describes the time allocation of students^{\prime} daily
activities. beagoodstudentandleadahealthy\to be a good student and \to lead a healthy life, one should maintain a routine. Study, play, recreation, school and home, sleep, etc. are the parts of a student's daily activities. As per the information contained in the pie chart, we find that a student needs spend25\to spend 25% time of a day at school and home. It shows that a student should spend 20% time of a day in his/her study. A student needs spendrecreationaltimewhichisnotmorethan12\to spend recreational time which is not more than 12% of the total time of a day. keep\to keep fit, a student needs physical exercise. Sport is one of them. In the afternoon, a student should play for some time which is helpful makethebodystrongandhealthyand5\to make the body strong and healthy and 5% time of a day is better for the allotment of game and sports. A student should spend 8% of the time of a day in doing other activities: From dawn \to dusk, a student is busy with his/her study, work, etc. A sound sleep is necessary for every human being. getridoffatigueand\to get rid of fatigue and tension, sleeping is the best medicine. So, sleep30\to sleep 30% of the total time of a day seems be\to be optimum. However, if students maintain the above time allocation, they must attain success in life. বাংলা অনুবাদঃ প্রদত্ত পাই চার্টটি শিক্ষার্থীদের দৈনন্দিন কার্যক্রমের সময় বণ্টনকে নিখুঁতভাবে বর্ণনা করে। একজন ভালো শিক্ষার্থী হতে এবং সুস্থ জীবনযাপন করতে, একজন শিক্ষার্থীর রুটিন মেনে চলা প্রয়োজন। পড়াশোনা, খেলাধুলা, বিনোদন, স্কুল এবং বাড়ি, ঘুম ইত্যাদি শিক্ষার্থীদের দৈনন্দিন কার্যক্রমের অংশ। পাই চার্টের তথ্য অনুযায়ী, দেখা যায় একজন শিক্ষার্থীকে তার দিনের ২৫% সময় স্কুল এবং বাড়িতে ব্যয় করতে হয়। চার্ট থেকে বোঝা যায় যে একজন শিক্ষার্থীর পড়াশোনায় দিনের ২০% সময় ব্যয় করা উচিত। একজন শিক্ষার্থীর বিনোদনের জন্য সময় প্রয়োজন, যা দিনের মোট সময়ের ১২%-এর বেশি নয়। শারীরিকভাবে সুস্থ থাকতে শিক্ষার্থীর শারীরিক ব্যায়ামের প্রয়োজন। খেলাধুলা এর একটি গুরুত্বপূর্ণ অংশ। বিকেলে শিক্ষার্থীর কিছু সময় খেলাধুলায় ব্যয় করা উচিত, যা শরীরকে মজবুত এবং স্বাস্থ্যকর করতে সাহায্য করে। এ জন্য দিনের ৫% সময় খেলাধুলার জন্য বরাদ্দ করা উত্তম। একজন শিক্ষার্থীকে তার দিনের ৮% সময় অন্যান্য কাজে ব্যয় করা উচিত। ভোর থেকে সন্ধ্যা পর্যন্ত একজন শিক্ষার্থী তার পড়াশোনা এবং অন্যান্য কাজ নিয়ে ব্যস্ত থাকে। প্রতিটি মানুষের জন্য একটি সুষ্ঠু ঘুম অত্যন্ত প্রয়োজনীয়। ক্লান্তি এবং মানসিক চাপ দূর করতে ঘুম হলো সেরা ওষুধ। তাই দিনের মোট সময়ের ৩০% ঘুমানোর জন্য বরাদ্দ করা যথাযথ। তবে, যদি শিক্ষার্থীরা উপরের সময় বণ্টন অনুসরণ করে, তবে তারা জীবনে অবশ্যই সাফল্য অর্জন করবে।
HSCEnglish 1st PaperWriting : Interpreting graph/chartComilla
12টি সম্পর্কিত প্রশ্ন — উত্তর ও ব্যাখ্যা লকড

1.সৃজনশীল প্রশ্ন · Barisal

Barisal Board · 2017

The pie-chart below shows the percentage of a family's household income distributed into different categories. Describe the pie-chart in 150 words:— question image

উত্তর ও ব্যাখ্যা দেখতে ফ্রি রেজিস্ট্রেশন করো

ফ্রি শুরু করো

2.সৃজনশীল প্রশ্ন · Barisal

Barisal Board · 2017

The pie-chart below shows the percentage of a family's household income distributed into different categories. Describe the pie-chart in 150 words:— question image

উত্তর ও ব্যাখ্যা দেখতে ফ্রি রেজিস্ট্রেশন করো

ফ্রি শুরু করো

3.সৃজনশীল প্রশ্ন · Sylhet

Sylhet Board · 2017

The pie chart below shows the percentages of transportation used by 800 students come\to come \to college. Describe the chart in 150 words. question image

উত্তর ও ব্যাখ্যা দেখতে ফ্রি রেজিস্ট্রেশন করো

ফ্রি শুরু করো

4.সৃজনশীল প্রশ্ন · Sylhet

Sylhet Board · 2017

The pie chart below shows the percentages of transportation used by 800 students come\to come \to college. Describe the chart in 150 words. question image

উত্তর ও ব্যাখ্যা দেখতে ফ্রি রেজিস্ট্রেশন করো

ফ্রি শুরু করো

5.সৃজনশীল প্রশ্ন · Chittagong

Chittagong Board · 2017

The graph chart shows the choice of profession by educated people in our country. Describe the graph in at least 150 words:—

উত্তর ও ব্যাখ্যা দেখতে ফ্রি রেজিস্ট্রেশন করো

ফ্রি শুরু করো

6.সৃজনশীল প্রশ্ন · Chittagong

Chittagong Board · 2017

The graph chart shows the choice of profession by educated people in our country. Describe the graph in at least 150 words:—

উত্তর ও ব্যাখ্যা দেখতে ফ্রি রেজিস্ট্রেশন করো

ফ্রি শুরু করো

7.সৃজনশীল প্রশ্ন · Jessore

Jessore Board · 2017

The graph below shows "The number of people living below the poverty line from 1995 to 2010". Describe the graph in 150 words. You should highlight and summarize the information given in the graph.

উত্তর ও ব্যাখ্যা দেখতে ফ্রি রেজিস্ট্রেশন করো

ফ্রি শুরু করো

8.সৃজনশীল প্রশ্ন · Jessore

Jessore Board · 2017

The graph below shows "The number of people living below the poverty line from 1995 to 2010". Describe the graph in 150 words. You should highlight and summarize the information given in the graph.

উত্তর ও ব্যাখ্যা দেখতে ফ্রি রেজিস্ট্রেশন করো

ফ্রি শুরু করো

9.সৃজনশীল প্রশ্ন · Dinajpur

Dinajpur Board · 2017

Look at the chart below. It shows the sources of air pollution in a city. Now, analyze the chart in at least 150 words focusing the main aspects.

উত্তর ও ব্যাখ্যা দেখতে ফ্রি রেজিস্ট্রেশন করো

ফ্রি শুরু করো

10.সৃজনশীল প্রশ্ন · Dinajpur

Dinajpur Board · 2017

Look at the chart below. It shows the sources of air pollution in a city. Now, analyze the chart in at least 150 words focusing the main aspects.

উত্তর ও ব্যাখ্যা দেখতে ফ্রি রেজিস্ট্রেশন করো

ফ্রি শুরু করো

11.সৃজনশীল প্রশ্ন · Rajshahi

Rajshahi Board · 2017

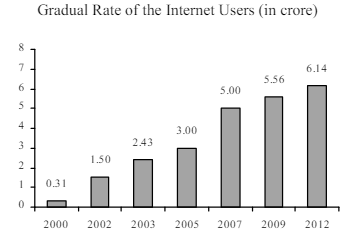
The graph below shows the gradual rate of the internet users in Bangladesh. Describe the graph in at least 150 words. You should highlight the information and report the main features given in the graph. question image

উত্তর ও ব্যাখ্যা দেখতে ফ্রি রেজিস্ট্রেশন করো

ফ্রি শুরু করো

12.সৃজনশীল প্রশ্ন · Rajshahi

Rajshahi Board · 2017

The graph below shows the gradual rate of the internet users in Bangladesh. Describe the graph in at least 150 words. You should highlight the information and report the main features given in the graph. question image

উত্তর ও ব্যাখ্যা দেখতে ফ্রি রেজিস্ট্রেশন করো

ফ্রি শুরু করো

আরো প্রশ্ন দেখো

আরো হাজারো প্রশ্ন + মডেল টেস্ট

ফ্রি রেজিস্ট্রেশন করো — ফেভারিট, AI টিউটর, লিডারবোর্ড ও অ্যানালিটিক্স আনলক করো।