
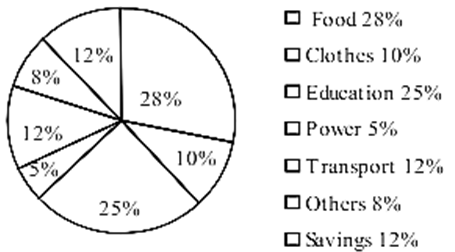
The pie chart below shows the percentage of a family's household income distributed into different categories. Now, describe the pie chart in 150 words. [চিত্র]
উত্তর: The distribution of a middle-class family's monthly income into different categories (%) The given pie chart embodies the outcome of a survey carried out on the percentages of monthly expenses of a particular middle class family in Bangladesh. The chart shows that the family spends 28% of the total monthly income on food items. The family spends 25% of the total income for education purpose. The family spends 10% and 12% on the purchase of clothes and the use of transport respectively. Likewise, the family spends 5% and 8% on the consumption of power including electricity and miscellaneous items for family use respectively. The family, after meeting all necessities, saves 12% of the total monthly income. A close study of the chart reveals that the family spends the highest amount of monthly income (28%) on food items and the lowest amount on the consumption of power. The family is an ideal one, because it allots a reasonable amount (25%) on the education of the children. Finally, the family is aware of its future prospect and so it saves a considerable amount (12%).
HSC English 1st Paper CQ — Prosthuti প্রশ্নব্যাংক
HSC · English 1st Paper · সৃজনশীল
The pie chart below shows the percentage of a family's household income distributed into different categories. Now, describe the pie chart in 150 words.
উত্তর