
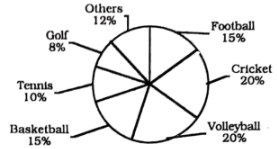
The pie chart shows different sports and the percentage of people who like then. Now, describe the chart in about 80 words. You should highlight and summarize the information given in the chart. Different sports and the percentage of people like them [চিত্র]
উত্তর: Different sports and the percentage of people liking them Here the pie chart puts up different sports and the percentage of people who like them. According to information on the chart, 15% of the people love football and 20% of them like cricket. People liking volleyball, basketball, tennis and golf are 20%, 15%, 10% and 8% respectively. The rest of the game-lovers-that is, 12% of the people like miscellaneous (বিবিধ) games. Thus, it is clear that the same number of people like cricket and volleyball, (20%) and as such, cricket and volleyball simultaneously occupy the first position in order of preference by the people. Football and basketball, at 15%, simultaneously (একই সাথে) hold the second position. Miscellaneous (বিবিধ) games hold the third position, tennis fourth position and golf last position in this respect.
HSC English 1st Paper CQ — Prosthuti প্রশ্নব্যাংক
HSC · English 1st Paper · সৃজনশীল
The pie chart shows different sports and the percentage of people who like then. Now, describe the chart in about 80 words. You should highlight and summarize the information given in the chart.
Different sports and the percentage of people like them
উত্তর