
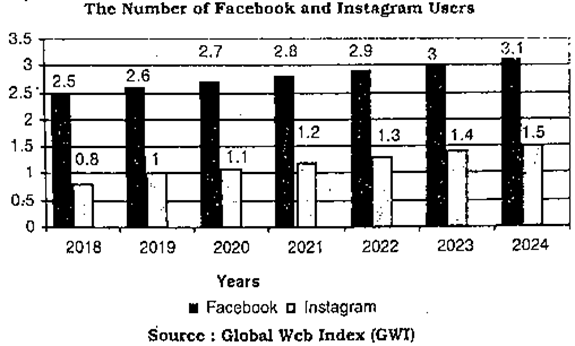
The graph below compares the number of Facebook and Instagram users. Write a descriptive analysis of the graph, highlighting the key trends and significant data points presented. [চিত্র]
উত্তর: The number of Facebook and Instagram users The image displays a bar chart (graph) comparing the regular users of Facebook and Instagram over the years 2018 to 2024. The data is presented in billion units. Overall, Facebook users experienced significant growth over the years while users of Instagram dimmed in their numbers. Initially, the Facebook users were 2.5 billion and the users of Instagram were 0.8 billion in 2018, the first year of the survey period. However, in 2019, the second year of the survey period, the number of Facebook users grew up [গণিত] 0.1 billion whereas the number of Instagram users grew up [গণিত] 0.2 billion. Conversely (বিপরীতভাবে), from 2020 to 2024 from the third year of the survey period to the last year of the same, the growth of the users in both the platforms was interestingly unique and it was 0.1 billion each year. That means, in 2021, 2022, 2023 and in 2024, the number of Facebook users stood at 2.8 billion, 2.9 billion, 3 billion and 3.1 billion respectively. Similarly, the number of Instagram users in same years stood at 1.2 billion, 1.3 billion, 1.4 billion and 1.5 billion respectively. To sum up, it is observed that over the survey period, the number of Facebook and Instagram users grew in a slow but steady manner. However, precisely (যথাযথভাবে), the gap between the number of the two different platforms users is apparently (দৃশ্যত) wide which indicates that Facebook is still far more popular than Instagram.
HSC English 1st Paper CQ — Prosthuti প্রশ্নব্যাংক
HSC · English 1st Paper · সৃজনশীল
The graph below compares the number of Facebook and Instagram users. Write a descriptive analysis of the graph, highlighting the key trends and significant data points presented.
উত্তর