
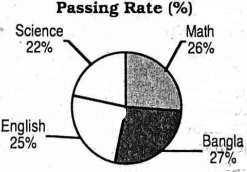
Look at the pie chart below. It shows the passing rates of different subjects of a school. Analyze the chart focusing on the following main points. [চিত্র]
উত্তর: The passing rates of different subjects of a school The pie chart shows the passing rates of the students [গণিত] of a school in different subjects. The subjects the students have passed are English, Bangla, Math, and Science. According [গণিত] the chart, 25% of the students have passed in English, 27% in Bangla, 26% in Mathematics, and 22% in Science. It is evident that the highest number of students has passed in Bangla, while the lowest (সর্বনিম্ন) number of students has passed in Science. So, it is crystal clear that the passing rate of the students varies from subject [গণিত] subject, and the pass rate is very low. However, students have [গণিত] improve in all the subjects because the pass rates are very disappointing. [গণিত] up, Bangla had the highest number of passes, but for the students, all the subjects were almost equally challenging.
HSC English 1st Paper CQ — Prosthuti প্রশ্নব্যাংক
HSC · English 1st Paper · সৃজনশীল
Look at the pie chart below. It shows the passing rates of different subjects of a school. Analyze the chart focusing on the following main points.
উত্তর