
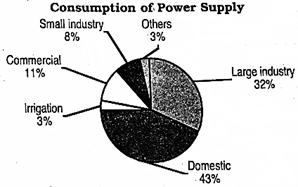
The pie chart below shows the consumption of power supply for different sectors. Describe the chart in 150 words. You should highlight and summarize the information and report the main features given in the chart. [চিত্র]
উত্তর: Consumption of Power Supply The pie chart illustrates the percentage consumption of power supply across six different sectors. Overall, domestic consumption is the dominant sector, accounting for nearly half of the total power usage, while the 'Others [গণিত] and 'Irrigation [গণিত] sectors consume the least amount of power. The largest share of power is consumed by the Domestic sector, which accounts for 43%. This is significantly higher than any other single sector. The next major consumer is the Large Industry sector, using 32% of the power supply. These two sectors combined are responsible for over three-quarters (75%) of the total consumption. The remaining power is distributed among smaller sectors. Commercial use represents 11%, followed by Small Industry at 8%. The sectors with the lowest consumption are Irrigation and Others, each accounting for only 3% of the total power supply. The data clearly indicates a concentration of power usage in residential and large industrial areas.
HSC English 1st Paper CQ — Prosthuti প্রশ্নব্যাংক
HSC · English 1st Paper · সৃজনশীল
The pie chart below shows the consumption of power supply for different sectors. Describe the chart in 150 words. You should highlight and summarize the information and report the main features given in the chart.
উত্তর