
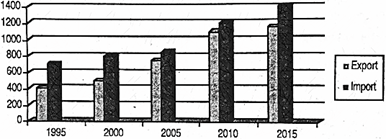
The graph below shows the export and import of Bangladesh from 1995 [গণিত] 2015 in billion dollars. (data is imaginary) Now, describe the graph in 100 words. [চিত্র]
উত্তর: Export and import of Bangladesh (1995-2015) The graph narrates the findings of a survey conducted on the exports and imports of Bangladesh in billion dollars covering a period of 21 years, from 1995 to 2015. Here, Imports and exports have been shown through two types of columns- the black coloured columns representing the imports and the white coloured columns showing the exports. We observe that in 1995, Bangladesh exported goods valued at 400 billion dollars, while she Imported goods worth 700 billion dollars. In 2000, her exported and imported goods valued at 500 billion dollars and 800 billion dollars respectively. In 2005, her exported and imported goods amounted to 700.5 and 900 billion dollars respectively. Again in 2010, her export and import of goods were valued at 1100 and 1200 billion dollars respectively (যথাক্রমে). Finally, in 2015, the exported goods amounted to 1150 billion dollars while her import was estimated at 1400 billion dollars. A close analysis of the graph makes it clear that the imports were higher all along than exports. Both exports and imports were on the ever increase. The exports could never surpass (অতিক্রম করা) the imports. And this signifies that the country's balance of trade is not favourable (অনুকূল)
HSC English 1st Paper CQ — Prosthuti প্রশ্নব্যাংক
HSC · English 1st Paper · সৃজনশীল
The graph below shows the export and import of Bangladesh from 1995 dollars. (data is imaginary) Now, describe the graph in 100 words.
উত্তর