
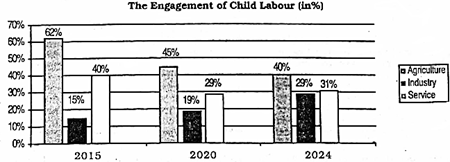
The graph shows the engagement of child labour in different sectors of 'X [গণিত] country from 2015 [গণিত] 2024. Describe the graph in 150 words. You should highlight the main features and summarize the information given in the graph. [চিত্র]
উত্তর: The provided [গণিত] graph illustrates the engagement of child labour across the Agriculture, Industry, and Service sectors in an unspecified country 'X [গণিত] over three specific years: 2015, 2020, and 2024. In 2015, the agricultural sector was the dominant employer of child labour, accounting for a substantial 62%. This was significantly higher than the 15% in industry and 40% in services. By 2020, there was a notable shift. While agriculture remained the leading sector at 45%, its share had decreased. The service sector saw a decrease [গণিত] 29%, and industry rose slightly [গণিত] 19%. The trend continued into 2024, with agriculture's share dropping further [গণিত] 40%. The service sector experienced a significant rise, reaching 31%, indicating a growing area for child labour. Industry also saw an increase [গণিত] 29%. Overall, the data highlights a consistent decline in the percentage of child labour in the agricultural sector across the observed period. Conversely, both the industry and service sectors showed an upward trend in child labour engagement, with the service sector experiencing the most significant proportional growth from 2015 [গণিত] 2024. The data suggests a shift in the primary sectors where child labour is prevalent.
HSC English 1st Paper CQ — Prosthuti প্রশ্নব্যাংক
HSC · English 1st Paper · সৃজনশীল
The graph shows the engagement of child labour in different sectors of ' words. You should highlight the main features and summarize the information given in the graph.
উত্তর