
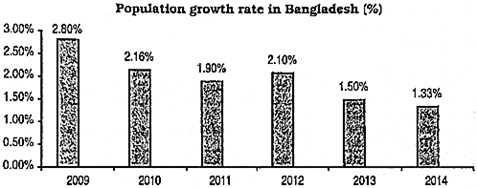
The graph below shows population growth rate from 2009 [গণিত] 2014. Describe the graph in 150 words. You should highlight and summarize the information given in the graph. [চিত্র]
উত্তর: The provided bar graph illustrates a consistent downward trend in the population growth rate of Bangladesh between 2009 and 2014. The rate started at its peak of 2.80% in 2009. In the subsequent years, the rate decreased to 2.16% in 2010 and further to 1.90% in 2011. There was a slight increase to 2.10% in 2012, but the downward trend resumed in 2013 with a rate of 1.50%. The period concluded with the lowest rate of 1.33% in 2014. Overall, the population growth rate nearly halved over the six-year period.
HSC English 1st Paper CQ — Prosthuti প্রশ্নব্যাংক
HSC · English 1st Paper · সৃজনশীল
The graph below shows population growth rate from 2009 words. You should highlight and summarize the information given in the graph.
উত্তর